Unlock a world of possibilities! Login now and discover the exclusive benefits awaiting you.
- Qlik Community
- :
- All Forums
- :
- QlikView App Dev
- :
- Top 10 sales in text and Gauge
- Subscribe to RSS Feed
- Mark Topic as New
- Mark Topic as Read
- Float this Topic for Current User
- Bookmark
- Subscribe
- Mute
- Printer Friendly Page
- Mark as New
- Bookmark
- Subscribe
- Mute
- Subscribe to RSS Feed
- Permalink
- Report Inappropriate Content
Top 10 sales in text and Gauge
Hi all 
I'm currently making a performance dashboard for our Sales department, and for that reason I'm trying to make a top 10 chart of sales people.
There is already a lot of other people who have asked similar questions, however I haven't been able to find the answer for my little project
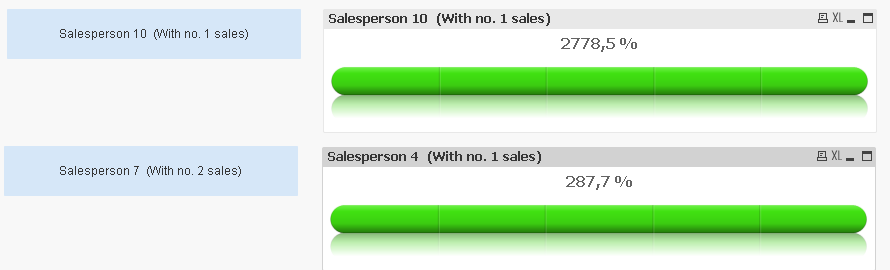
What I'm trying to is to have 10 text boxes and 10 gauge charts, where each pair is showing 1 of the top 10 salespersons.
Please se attached example.
Is that possible?
Regards
Stefan
- « Previous Replies
-
- 1
- 2
- Next Replies »
Accepted Solutions
- Mark as New
- Bookmark
- Subscribe
- Mute
- Subscribe to RSS Feed
- Permalink
- Report Inappropriate Content
- Mark as New
- Bookmark
- Subscribe
- Mute
- Subscribe to RSS Feed
- Permalink
- Report Inappropriate Content
I can't open your .qvw because i'am on personnal edition, but try with
Text box with the name of sales people:
Number 1=FirstSortedValue(Sales people, -sales,1)
Number 2=FirstSortedValue(Sales people, -sales,2)
Gauge chart with the sales amount:
Number 1=Max(Sales)
Number2= Max(Sales,2)
- Mark as New
- Bookmark
- Subscribe
- Mute
- Subscribe to RSS Feed
- Permalink
- Report Inappropriate Content
Hi Stefan,
see Attachment.
Regards,
Antonio.
- Mark as New
- Bookmark
- Subscribe
- Mute
- Subscribe to RSS Feed
- Permalink
- Report Inappropriate Content
Hi Jean-Baptiste
Thanks for your answer
The textbox would work if it was that simple, but the gauge doesn't work with Rank 2.
The sample is really simplistic. Meaning in the main file the sum of sales will have some limitations. Some set expression.
So in the mail file it would be something like this FirstSortedValue(Sales people, Sum( {< Region = {'1}' >} -sales),1)
and then it doesn't work.
- Mark as New
- Bookmark
- Subscribe
- Mute
- Subscribe to RSS Feed
- Permalink
- Report Inappropriate Content
Try with:
FirstSortedValue(Sales people, - Sum( {< Region = {'1'} >} sales),1)
- Mark as New
- Bookmark
- Subscribe
- Mute
- Subscribe to RSS Feed
- Permalink
- Report Inappropriate Content
Hi Antonio
That's really nice Seems to the job.
I've attached a new sample where budget (C) is included, can you make the expression so it includes that instead of total sales?
Regards
Stefan
- Mark as New
- Bookmark
- Subscribe
- Mute
- Subscribe to RSS Feed
- Permalink
- Report Inappropriate Content
In my Doc You can add Set Analysis directly in FirstSortedValue() and Max() functions, like
FistSortedValue({< Region = {'1}' >} A,-Aggr(Sum({< Region = {'1}' >} B),A))
Max({< Region = {'1}' >} ..........
- Mark as New
- Bookmark
- Subscribe
- Mute
- Subscribe to RSS Feed
- Permalink
- Report Inappropriate Content
So you want to use Field C instead of Field B?
- Mark as New
- Bookmark
- Subscribe
- Mute
- Subscribe to RSS Feed
- Permalink
- Report Inappropriate Content
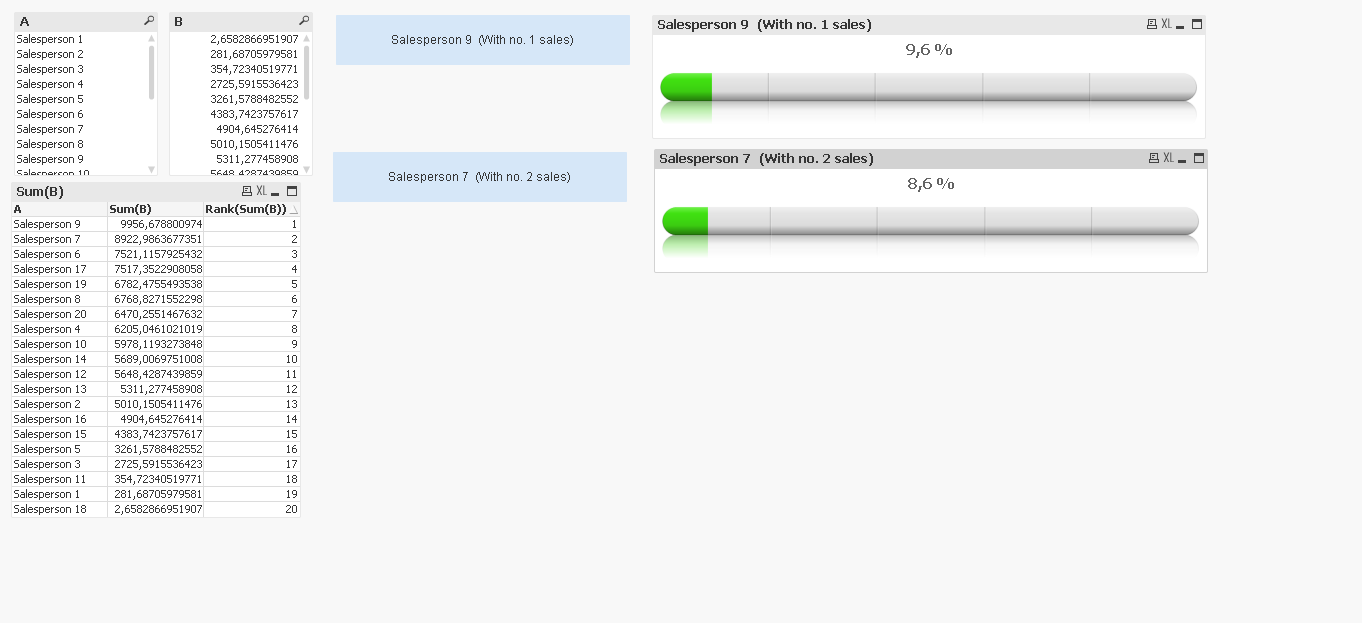
Yes like below.
However I want something like this:
=Num(Max(TOTAL Aggr(Sum(B),A),2) /Aggr(Sum(B), A),'#0,0 %')
To ensure that calculated share is based individual sales and budget.
- Mark as New
- Bookmark
- Subscribe
- Mute
- Subscribe to RSS Feed
- Permalink
- Report Inappropriate Content
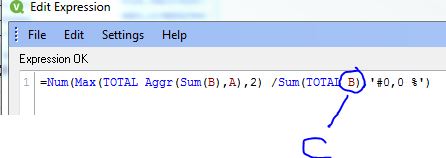
This expression
=Num(Max(TOTAL Aggr(Sum(B),A),2) /Aggr(Sum(B), A),'#0,0 %')
is different from your image that you just posted...
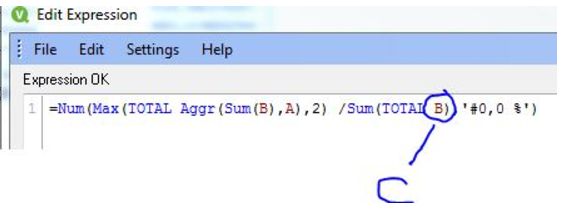
Not 100% sure what you are looking to get... May be Antonio might now better since he has been working with this thread....
- « Previous Replies
-
- 1
- 2
- Next Replies »