Unlock a world of possibilities! Login now and discover the exclusive benefits awaiting you.
- Qlik Community
- :
- All Forums
- :
- QlikView App Dev
- :
- Top 10 sales in text and Gauge
- Subscribe to RSS Feed
- Mark Topic as New
- Mark Topic as Read
- Float this Topic for Current User
- Bookmark
- Subscribe
- Mute
- Printer Friendly Page
- Mark as New
- Bookmark
- Subscribe
- Mute
- Subscribe to RSS Feed
- Permalink
- Report Inappropriate Content
Top 10 sales in text and Gauge
Hi all 
I'm currently making a performance dashboard for our Sales department, and for that reason I'm trying to make a top 10 chart of sales people.
There is already a lot of other people who have asked similar questions, however I haven't been able to find the answer for my little project
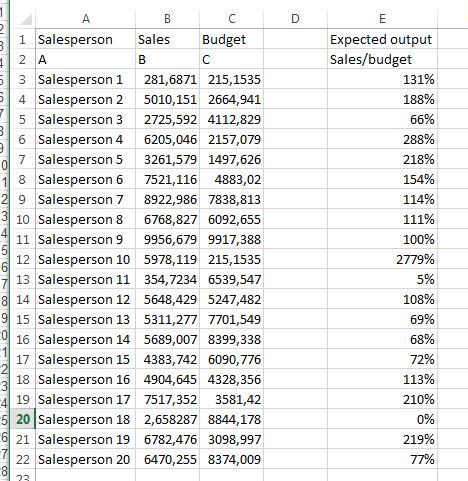
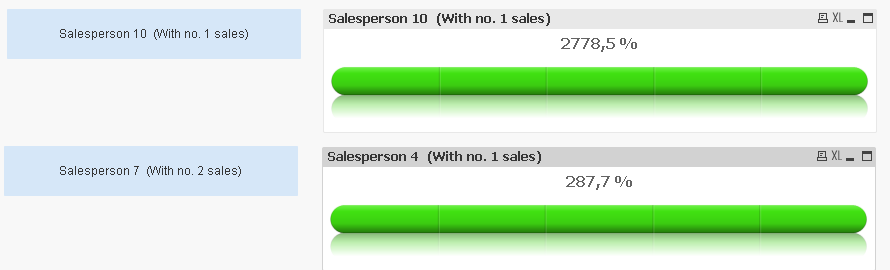
What I'm trying to is to have 10 text boxes and 10 gauge charts, where each pair is showing 1 of the top 10 salespersons.
Please se attached example.
Is that possible?
Regards
Stefan
- « Previous Replies
-
- 1
- 2
- Next Replies »
- Mark as New
- Bookmark
- Subscribe
- Mute
- Subscribe to RSS Feed
- Permalink
- Report Inappropriate Content
This is basically what I think the expression should look like to achieve what i want.
=Num(Max(TOTAL Aggr(Sum(B),A),2) /Aggr(Sum(C), A),'#0,0 %'
However it doesn't seem to work.
- Mark as New
- Bookmark
- Subscribe
- Mute
- Subscribe to RSS Feed
- Permalink
- Report Inappropriate Content
What is the expected output you are envisioning here?
- Mark as New
- Bookmark
- Subscribe
- Mute
- Subscribe to RSS Feed
- Permalink
- Report Inappropriate Content
The percentage is was I'm trying to achieve.
- Mark as New
- Bookmark
- Subscribe
- Mute
- Subscribe to RSS Feed
- Permalink
- Report Inappropriate Content
Try this
=Num(Aggr(Max(TOTAL Aggr(Sum(B),A),2)/Sum(If(A=FirstSortedValue(TOTAL A,-Aggr(Sum(B),A),2),C)),A),'#0,0 %')
- Mark as New
- Bookmark
- Subscribe
- Mute
- Subscribe to RSS Feed
- Permalink
- Report Inappropriate Content
I need C to be some kind of expression so I can include limitations.
Sum( {< Region = {'1}' >} C)
- Mark as New
- Bookmark
- Subscribe
- Mute
- Subscribe to RSS Feed
- Permalink
- Report Inappropriate Content
Like this?
- Mark as New
- Bookmark
- Subscribe
- Mute
- Subscribe to RSS Feed
- Permalink
- Report Inappropriate Content
Replace C with Your Expression.
There are no Region Fields in Your Attachment.
- Mark as New
- Bookmark
- Subscribe
- Mute
- Subscribe to RSS Feed
- Permalink
- Report Inappropriate Content
Yes exactly!
It seems to be doing the Job! 
Thanks so much!
- Mark as New
- Bookmark
- Subscribe
- Mute
- Subscribe to RSS Feed
- Permalink
- Report Inappropriate Content
Thanks for all the help Antonio
- Mark as New
- Bookmark
- Subscribe
- Mute
- Subscribe to RSS Feed
- Permalink
- Report Inappropriate Content
Like this
=Num(Aggr(Max({< Region = {'1}' >} TOTAL Aggr(Sum({< Region = {'1}' >} B),A),2)/Sum({< Region = {'1}' >} If(A=FirstSortedValue({< Region = {'1}' >} TOTAL A,-Aggr(Sum({< Region = {'1}' >}B),A),2),C)),A),'#0,0 %')
- « Previous Replies
-
- 1
- 2
- Next Replies »