Unlock a world of possibilities! Login now and discover the exclusive benefits awaiting you.
- Qlik Community
- :
- All Forums
- :
- QlikView App Dev
- :
- Top 5 Products by Market Share - Stacked Bar Chart
- Subscribe to RSS Feed
- Mark Topic as New
- Mark Topic as Read
- Float this Topic for Current User
- Bookmark
- Subscribe
- Mute
- Printer Friendly Page
- Mark as New
- Bookmark
- Subscribe
- Mute
- Subscribe to RSS Feed
- Permalink
- Report Inappropriate Content
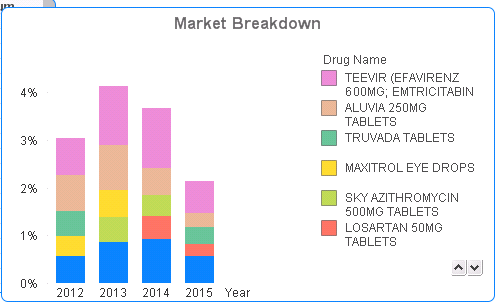
Top 5 Products by Market Share - Stacked Bar Chart
I have a stacked bar chart which i want to show the top 5 products by market share for each year. I am failing to format the table so that it shows the top 5 products by market share for the various years in the data set. An example application is attached. Please assist.
Accepted Solutions
- Mark as New
- Bookmark
- Subscribe
- Mute
- Subscribe to RSS Feed
- Permalink
- Report Inappropriate Content
maybe with this expression
if(rank(Sum([MedAid Amount]+Shortfall)/Sum(TOTAL([MedAid Amount]+Shortfall))) <= 5,
Sum([MedAid Amount]+Shortfall)/Sum(TOTAL([MedAid Amount]+Shortfall))
)
- Mark as New
- Bookmark
- Subscribe
- Mute
- Subscribe to RSS Feed
- Permalink
- Report Inappropriate Content
maybe with this expression
if(rank(Sum([MedAid Amount]+Shortfall)/Sum(TOTAL([MedAid Amount]+Shortfall))) <= 5,
Sum([MedAid Amount]+Shortfall)/Sum(TOTAL([MedAid Amount]+Shortfall))
)
- Mark as New
- Bookmark
- Subscribe
- Mute
- Subscribe to RSS Feed
- Permalink
- Report Inappropriate Content
Many thanks Maxgro, will use this and advise you accordingly
Regards.
- Mark as New
- Bookmark
- Subscribe
- Mute
- Subscribe to RSS Feed
- Permalink
- Report Inappropriate Content
Hi Maxgro
Kindly post the sample application as i am having trouble in reproducing your recommendations.
Regards.
- Mark as New
- Bookmark
- Subscribe
- Mute
- Subscribe to RSS Feed
- Permalink
- Report Inappropriate Content
PFA
- Mark as New
- Bookmark
- Subscribe
- Mute
- Subscribe to RSS Feed
- Permalink
- Report Inappropriate Content
Thank you Maxgro most appreciate