Unlock a world of possibilities! Login now and discover the exclusive benefits awaiting you.
- Qlik Community
- :
- All Forums
- :
- QlikView App Dev
- :
- Total column in pivot table
- Subscribe to RSS Feed
- Mark Topic as New
- Mark Topic as Read
- Float this Topic for Current User
- Bookmark
- Subscribe
- Mute
- Printer Friendly Page
- Mark as New
- Bookmark
- Subscribe
- Mute
- Subscribe to RSS Feed
- Permalink
- Report Inappropriate Content
Total column in pivot table
Hi Experts,
I have pivot table with a dimension set to horizontal.
I want the TOTAL column by counting all the YES values for both dimensions. I did this by enabling show partial sum on the 2nd dimension, how how can i count(BranchNo) ?
Also, i want this TOTAL column to sit vertically beside the Location dimension. I am not sure how to achieve this.
Please help.
- Mark as New
- Bookmark
- Subscribe
- Mute
- Subscribe to RSS Feed
- Permalink
- Report Inappropriate Content
Hi Suraj,
Maybe you can try the following expression, it will sum the Y and N.
Yes:
if(Qty = 'Y',count( Qty))
No:
if(Qty = 'Y',count( Qty))
Hope that helps.
Carlos
- Mark as New
- Bookmark
- Subscribe
- Mute
- Subscribe to RSS Feed
- Permalink
- Report Inappropriate Content
Hi Carlos,
Thanks for your reply.
I want only Y and N for the chart expressions.
I only want the count in the TOTAL column.
- Mark as New
- Bookmark
- Subscribe
- Mute
- Subscribe to RSS Feed
- Permalink
- Report Inappropriate Content
Hi,
Please find the attached. hope that helps
- Mark as New
- Bookmark
- Subscribe
- Mute
- Subscribe to RSS Feed
- Permalink
- Report Inappropriate Content
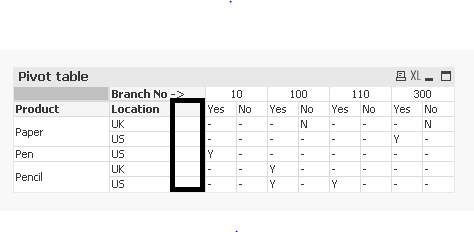
I think i didn't explain my requirement properly.
I don't want to change my existing expressions in the chart.
I only wan to have a new column that tells the total count of 'Y' values, beside the location column.
!
Thanks.
- Mark as New
- Bookmark
- Subscribe
- Mute
- Subscribe to RSS Feed
- Permalink
- Report Inappropriate Content
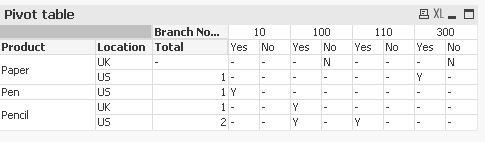
something like this?
- Mark as New
- Bookmark
- Subscribe
- Mute
- Subscribe to RSS Feed
- Permalink
- Report Inappropriate Content
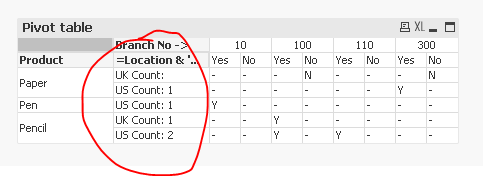
May be like this?
=Location & ' Count: ' & Aggr(Count(DISTINCT{<Qty = {'Y'}>}[Branch No]), Product, Location)