Unlock a world of possibilities! Login now and discover the exclusive benefits awaiting you.
- Qlik Community
- :
- All Forums
- :
- QlikView App Dev
- :
- Total in staright table
- Subscribe to RSS Feed
- Mark Topic as New
- Mark Topic as Read
- Float this Topic for Current User
- Bookmark
- Subscribe
- Mute
- Printer Friendly Page
- Mark as New
- Bookmark
- Subscribe
- Mute
- Subscribe to RSS Feed
- Permalink
- Report Inappropriate Content
Total in staright table
Hi
I have the below straight table
The formula for the total column is (days*volume*(0.3))+(days*volume)/150 = total
| employee | id | days | volume | total |
| a | 1 | 27 | 0.020116677 | 0.004707302 |
| a | 2 | 3 | 0.024473813 | 0.000636319 |
| a | 3 | 94 | 0.02513826 | 0.020479303 |
My output should be as below
| employee | total |
| a | 0.025822924 |
i'm using the below formula i'm getting correct answer if i'm adding the ID field, but i dont want to show ID field and a unique employee
= sum(days* volume*0.3)+ sum(days)*sum( distinct volume) /150
Accepted Solutions
- Mark as New
- Bookmark
- Subscribe
- Mute
- Subscribe to RSS Feed
- Permalink
- Report Inappropriate Content
Try this:
=Sum(Aggr(Sum(days* volume*0.3) + Sum(days) * Sum(DISTINCT volume) /150, employee, id))
- Mark as New
- Bookmark
- Subscribe
- Mute
- Subscribe to RSS Feed
- Permalink
- Report Inappropriate Content
Try this:
=Sum(Aggr(Sum(days* volume*0.3) + Sum(days) * Sum(DISTINCT volume) /150, employee, id))
- Mark as New
- Bookmark
- Subscribe
- Mute
- Subscribe to RSS Feed
- Permalink
- Report Inappropriate Content
Hi Sunny its giving me very high value when compared to the actual value
its giving me 23.050 but the value is 0.65143....
| employee | id | days | volume | total | |
| a | 1 | 983 | 0.764653784219 |
|
- Mark as New
- Bookmark
- Subscribe
- Mute
- Subscribe to RSS Feed
- Permalink
- Report Inappropriate Content
Would you be able to share a sample where this isn't working?
- Mark as New
- Bookmark
- Subscribe
- Mute
- Subscribe to RSS Feed
- Permalink
- Report Inappropriate Content
Hi John, are you pre-calculating the total amount in your load script?
If not, I would suggest that you consider moving this calculation to the script.
If you're wanting to calculate it in a chart, then I would imagine an expression like the one below would suffice:
sum(((days*volume*0.3)+(days*volume))/150)
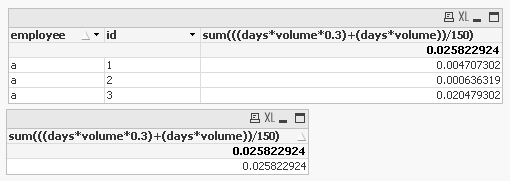
S.
- Mark as New
- Bookmark
- Subscribe
- Mute
- Subscribe to RSS Feed
- Permalink
- Report Inappropriate Content
Try to create one variable for 0.3 like
LET Vstatic = num('0.3','##.##0')
Then use this variable in to that expression
- Mark as New
- Bookmark
- Subscribe
- Mute
- Subscribe to RSS Feed
- Permalink
- Report Inappropriate Content
Hi John,
Try this..
=Sum(Aggr((Sum(days* volume*0.3) + Sum(days) * Sum(DISTINCT volume)) /150,Employee,Id))
- Mark as New
- Bookmark
- Subscribe
- Mute
- Subscribe to RSS Feed
- Permalink
- Report Inappropriate Content
Sunny T's approach would work if the data was just those 3 rows. I suspect that this is not the raw data (the DISTINCT is the main clue).
If my suspicion is correct, please describe or show us the raw data
- Mark as New
- Bookmark
- Subscribe
- Mute
- Subscribe to RSS Feed
- Permalink
- Report Inappropriate Content
Hi sunny tanks a lot and the problem is resolved now
- Mark as New
- Bookmark
- Subscribe
- Mute
- Subscribe to RSS Feed
- Permalink
- Report Inappropriate Content
Can you please help me out in the below senarios