Unlock a world of possibilities! Login now and discover the exclusive benefits awaiting you.
- Qlik Community
- :
- All Forums
- :
- QlikView App Dev
- :
- Trendline to measure performance
- Subscribe to RSS Feed
- Mark Topic as New
- Mark Topic as Read
- Float this Topic for Current User
- Bookmark
- Subscribe
- Mute
- Printer Friendly Page
- Mark as New
- Bookmark
- Subscribe
- Mute
- Subscribe to RSS Feed
- Permalink
- Report Inappropriate Content
Trendline to measure performance
Hi.
Just wondering if anybody could help me with a query.
My list boxes heading are as follows Name, CompanyName, CompanyID and MonthYear.
e.g. Steven, Dunnes Stores, 678899, May2015
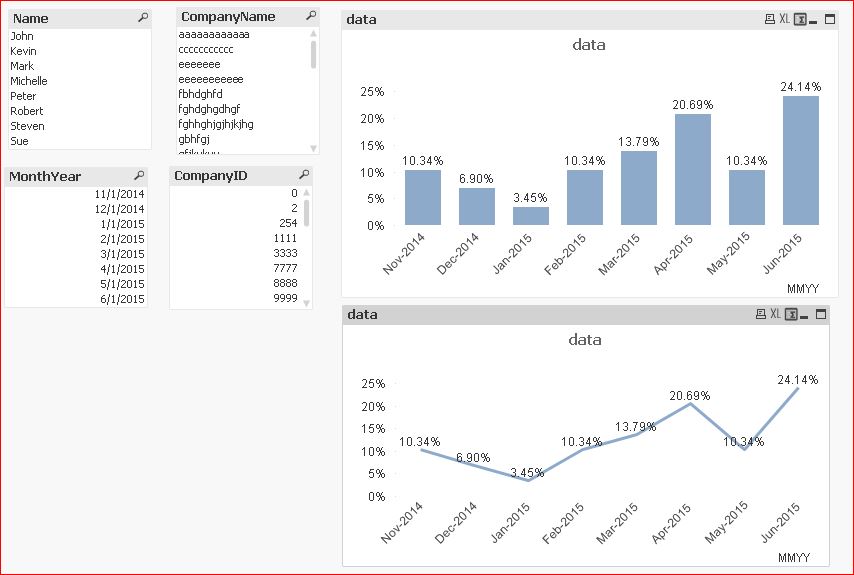
I am looking to create a graph that measures the performance of the business month on month. Maybe a bar chart showing the number of companies signed e.g Company Name and showing a trendline on a bar chart showing the performance in sales month on month.
Where CompanyName is where a company is signed up and month Year is the month Year they signed up e.g. June2015
I would also be looking to do similar with the Name list box measuring Sales rep performances month on month.
Where name is a sales rep and monthyear is the number of sales they made month on month.
I think bar charts with a trendline showing the % increase or decrease month on month is the best way to present the data but I am open to suggestions.
Attached is a sample file of something similar to the data I will be working with.
If anyone could help it would be great.
King regards,
- Tags:
- new_to_qlikview
- Mark as New
- Bookmark
- Subscribe
- Mute
- Subscribe to RSS Feed
- Permalink
- Report Inappropriate Content
Hi,
Check this may be give the idea.
- Mark as New
- Bookmark
- Subscribe
- Mute
- Subscribe to RSS Feed
- Permalink
- Report Inappropriate Content
Hi settu ,
Thanks for the reply unfortunately I am using the personal edition at the moment so I cannot open the file.
Is their anyway you can paste in what you suggested here if it is at all possible.
Thanks.
- Mark as New
- Bookmark
- Subscribe
- Mute
- Subscribe to RSS Feed
- Permalink
- Report Inappropriate Content
Hi,
Just check the below screen shot. if it is useful, then will provide the steps.
- Mark as New
- Bookmark
- Subscribe
- Mute
- Subscribe to RSS Feed
- Permalink
- Report Inappropriate Content
Hi,
Yes that would be great.
- Mark as New
- Bookmark
- Subscribe
- Mute
- Subscribe to RSS Feed
- Permalink
- Report Inappropriate Content
Hi,
find the attached.