Unlock a world of possibilities! Login now and discover the exclusive benefits awaiting you.
- Qlik Community
- :
- All Forums
- :
- QlikView App Dev
- :
- Try to use line chart with two measures
- Subscribe to RSS Feed
- Mark Topic as New
- Mark Topic as Read
- Float this Topic for Current User
- Bookmark
- Subscribe
- Mute
- Printer Friendly Page
- Mark as New
- Bookmark
- Subscribe
- Mute
- Subscribe to RSS Feed
- Permalink
- Report Inappropriate Content
Try to use line chart with two measures
Hi,
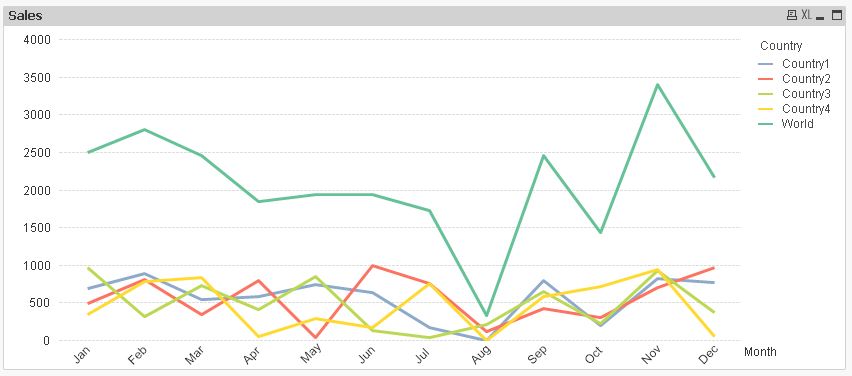
Can I have two dimensions and two measures on a line chart?
My target is
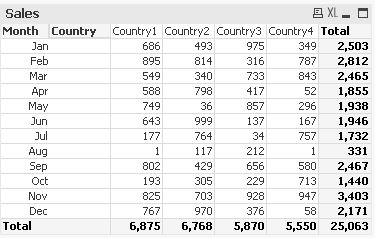
1) display the sales over the year per country = first measure
2) then draw a line that is the total of the sales worldwide. (with Rangesum) = second measure
--> All this on the same chart.
Thanks
- Mark as New
- Bookmark
- Subscribe
- Mute
- Subscribe to RSS Feed
- Permalink
- Report Inappropriate Content
I don't think that it would be work like you expected it with one line-chart. A quite common alternative for such things is to use two or even more charts and to overlay them - by adjusting various layout-options to hide titles, axis and/or to make them transparent - beside some inbuilt options for this you could also use a function like argb(0,0,0,0).
- Marcus
- Mark as New
- Bookmark
- Subscribe
- Mute
- Subscribe to RSS Feed
- Permalink
- Report Inappropriate Content
Ok, Thanks for the advice.
How can I overlay two charts? just drop them on each other doesn't work.
thanks
- Mark as New
- Bookmark
- Subscribe
- Mute
- Subscribe to RSS Feed
- Permalink
- Report Inappropriate Content
Hi,
maybe one solution might be also:
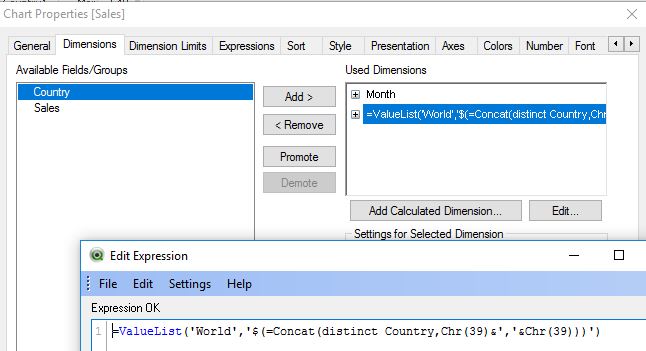
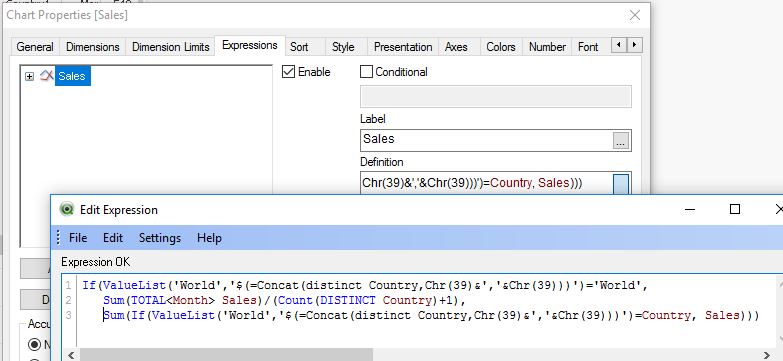
(I guess there should be a shorter expression to solve this issue though)
hope this helps
regards
Marco
- Mark as New
- Bookmark
- Subscribe
- Mute
- Subscribe to RSS Feed
- Permalink
- Report Inappropriate Content
You would need to set the transparency to 100% for the top chart in colors tab of chart property.
I would like to suggest another approach:
Create a dimension that loads all your countries and add an additional value for 'World', which links to all Countries.
NewDimLinkTable:
LOAD Country,
Country as NewDim
FROM ...;
CONCATENATE
LOAD Country,
'World' as NewDim
FROM ...;
Now use NewDim as second dimension in your chart.