Unlock a world of possibilities! Login now and discover the exclusive benefits awaiting you.
- Qlik Community
- :
- All Forums
- :
- QlikView App Dev
- :
- Use of Set analysis - with MonthName(myDate) on x ...
- Subscribe to RSS Feed
- Mark Topic as New
- Mark Topic as Read
- Float this Topic for Current User
- Bookmark
- Subscribe
- Mute
- Printer Friendly Page
- Mark as New
- Bookmark
- Subscribe
- Mute
- Subscribe to RSS Feed
- Permalink
- Report Inappropriate Content
Use of Set analysis - with MonthName(myDate) on x axis
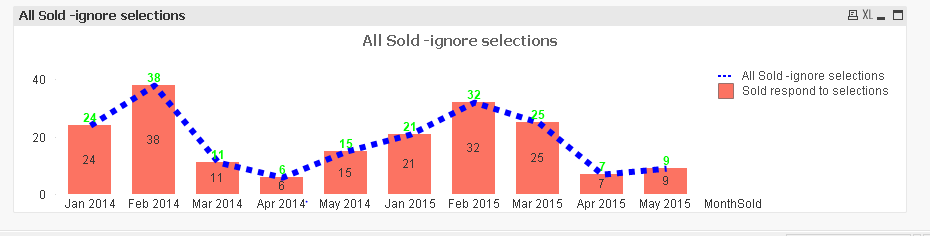
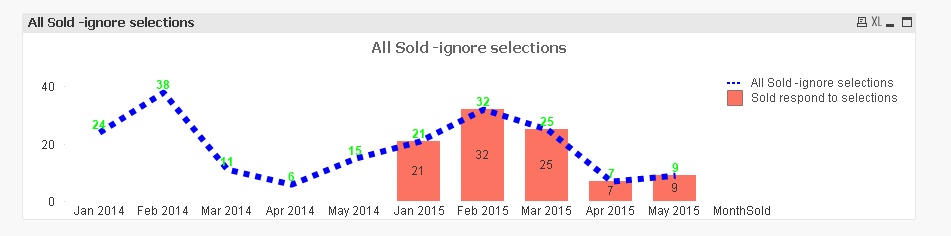
This is about "the look" .
I have used MonthName(myDate) as the x axis and users could then choose a financial year so from say 36 months on the x axis - the x axis then changes to the 12 months chosen.
When i use Set Analysis - the 12 months are shown correctly but 36 months remain showing on the x axis.
Can I force the x axis to show only the 12 months I want shown?

- Mark as New
- Bookmark
- Subscribe
- Mute
- Subscribe to RSS Feed
- Permalink
- Report Inappropriate Content
Yes.. Provide sample data to work... You can either use Calculated Dimension or Use IF Or Set Analysis in Expression.
- Mark as New
- Bookmark
- Subscribe
- Mute
- Subscribe to RSS Feed
- Permalink
- Report Inappropriate Content
this is the file (do I need to send the excel file???)
Jo
- Mark as New
- Bookmark
- Subscribe
- Mute
- Subscribe to RSS Feed
- Permalink
- Report Inappropriate Content
Excel file would be better solution...
- Mark as New
- Bookmark
- Subscribe
- Mute
- Subscribe to RSS Feed
- Permalink
- Report Inappropriate Content
josephinetedesco wrote:
This is about "the look" .
I have used MonthName(myDate) as the x axis and users could then choose a financial year so from say 36 months on the x axis - the x axis then changes to the 12 months chosen.
When i use Set Analysis - the 12 months are shown correctly but 36 months remain showing on the x axis.
Can I force the x axis to show only the 12 months I want shown?

- Mark as New
- Bookmark
- Subscribe
- Mute
- Subscribe to RSS Feed
- Permalink
- Report Inappropriate Content
the Excel file.
- Mark as New
- Bookmark
- Subscribe
- Mute
- Subscribe to RSS Feed
- Permalink
- Report Inappropriate Content
Instead of 3 in set analysis, use 12 for your 12 months requirements.
Hope this would help...
- Mark as New
- Bookmark
- Subscribe
- Mute
- Subscribe to RSS Feed
- Permalink
- Report Inappropriate Content
Hi Mannish
I think I sent this message off somewhere else ☺
Jo
SUM({}NumSold)
So this means
Sum NumSold,
Where MonthYear = (Max of MonthYear –3 )
And MonthYear is less than or equal to (Max of MonthYear)
So if I changed from 3 to 12 this would be saying
Sum NumSold
Where MonthYear = (1 year less than the max of MonthYear)
And MonthYear is <= (Maximum of MonthYear)
I will try this when I get home (If I am at home, I cannot access the qvw file and if I am at work I cannot access the community reply capability ….)
Jo
- Mark as New
- Bookmark
- Subscribe
- Mute
- Subscribe to RSS Feed
- Permalink
- Report Inappropriate Content
Hi
Do you think the problem is that I am asking the computer to do 2 things and they are mutually exclusive?
It can “ignore all selections” – in which case it gets the sum sold for all the months in the dataset
OR
It can give me the sum sold for the months chosen
But I suppose it cannot do both …