Unlock a world of possibilities! Login now and discover the exclusive benefits awaiting you.
- Qlik Community
- :
- All Forums
- :
- QlikView App Dev
- :
- Using Class to display Dimension in %
- Subscribe to RSS Feed
- Mark Topic as New
- Mark Topic as Read
- Float this Topic for Current User
- Bookmark
- Subscribe
- Mute
- Printer Friendly Page
- Mark as New
- Bookmark
- Subscribe
- Mute
- Subscribe to RSS Feed
- Permalink
- Report Inappropriate Content
Using Class to display Dimension in %
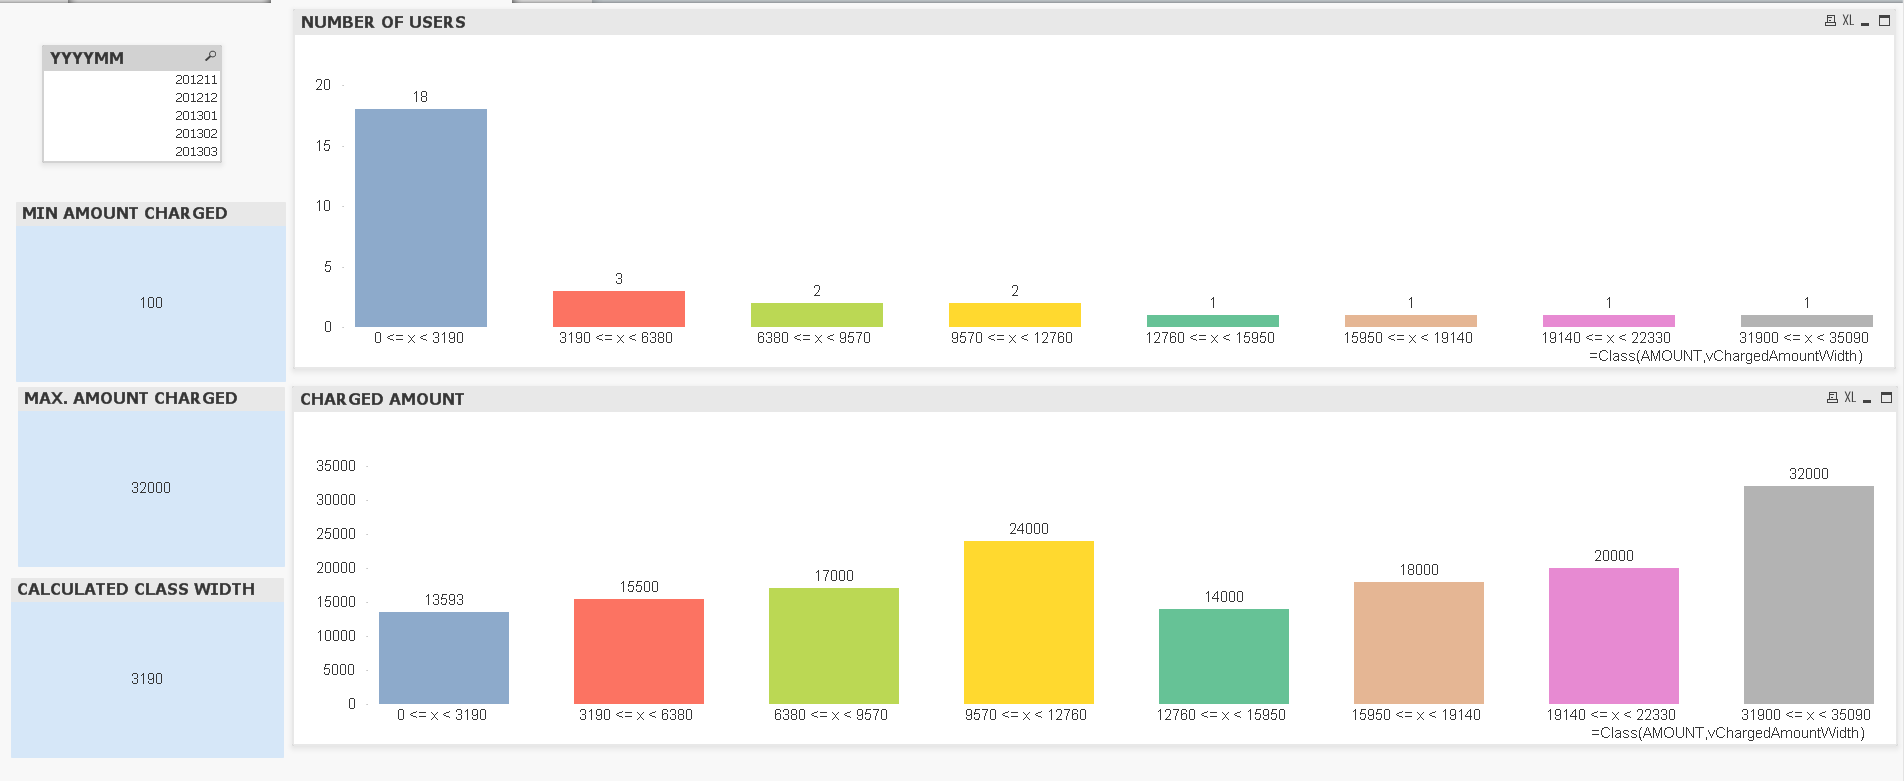
I have 3 Variables defined as follows
vMinChargedAmount Min(CHARGED_AMOUNT)
vMaxChargedAmount Max(CHARGED_AMOUNT)
vChargedAmountWidth =(($(vMaxChargedAmount) - $(vMinChargedAmount))/10)
I am creating a bar chart with dimension as follows
=Class(CHARGED_AMOUNT,$(vChargedAmountWidth))
Expression
Count (DISTINCT CHARGED_AMOUNT)
Basically I am trying to calculate the Class width through variable. (Refer to the attachment for better image) This works.
The variables will calculate the Class function width for every 10%..
vMinChargedAmount Min(CHARGED_AMOUNT)
vMaxChargedAmount Max(CHARGED_AMOUNT)
vChargedAmountWidth =(($(vMaxChargedAmount) - $(vMinChargedAmount))/10)
My problem is I do not want to display the numeric values for X axis (Dimension)
I want the Calculated Dimension values to display as %
0% <= x < 10%
10% <= x < 20%
20% <= x < 30%
30% <= x < 40%
40% <= x < 50%
:
:
90% <= x < 100%
Any way to implement?
Thank you
Accepted Solutions
- Mark as New
- Bookmark
- Subscribe
- Mute
- Subscribe to RSS Feed
- Permalink
- Report Inappropriate Content
Can't you create a new field for Charged_Amount in which you calculate the percentages?
So Percentage_Charged_Amount can be calculated by (Charged_Amount/max(Charged_Amount))*100 which gives you a number between 0 and 100.
Another option could be to creating 2 fields, a lower and a upper bound per Charged_Amount. If the percentage 5% will get the lower bound 0 and 10. Then you can use a calculated dimension like: =LowerBound & ' % <= x < ' & UpperBound & ' %'
I hope that this is something that you can use.