Unlock a world of possibilities! Login now and discover the exclusive benefits awaiting you.
- Qlik Community
- :
- All Forums
- :
- QlikView App Dev
- :
- Re: Using max and fractile and Aggr to Group simil...
- Subscribe to RSS Feed
- Mark Topic as New
- Mark Topic as Read
- Float this Topic for Current User
- Bookmark
- Subscribe
- Mute
- Printer Friendly Page
- Mark as New
- Bookmark
- Subscribe
- Mute
- Subscribe to RSS Feed
- Permalink
- Report Inappropriate Content
Using max and fractile and Aggr to Group similar products
Hi,
I am struggling to get the following to function
I need to be able to find the maximum unit price of similar products ( ATCLEVEL5, PREPERATION,) and then only display those items which arethe 60th percentile of the products in that group? I have tried using AGGR and set analysis, but seem to come unstuck?
Thanks in Advance for any suggestions
| Disease | Description | Unique ID | @5 | @6 | Dispensing Volume Pack size | Drug Schedule | ATCLevel5 | PREPERATION | Newfield | GenericInd | Price | Fractile(UnitPrice,.75) | max(UnitPrice) |
| 8.496 | 63.01944107 | ||||||||||||
| Acute GE | DYNAFORCE BLUEBERRY | 3000524001 | 12 | 0 | A07CA00 | SAC | Include | 98.02 | 8.168333333 | 8.168333333 | |||
| Acute GE | DYNAFORCE CHERRY GRAPE | 3000527001 | 12 | 0 | A07CA00 | SAC | Include | 98.02 | 8.168333333 | 8.168333333 | |||
| Acute GE | DYNAFORCE NAARTJIE | 3000525001 | 12 | 0 | A07CA00 | SAC | Include | 98.02 | 8.168333333 | 8.168333333 | |||
| Acute GE | DYNAFORCE TROPICAL | 3000526001 | 12 | 0 | A07CA00 | SAC | Include | 98.02 | 8.168333333 | 8.168333333 | |||
| Acute GE | NUDRATE BLACKCURRANT | 720393003 | 6 | 0 | A07CA00 | SAC | Include | 49.5 | 9.339622642 | 9.339622642 | |||
| Acute GE | NUDRATE CITRUS | 718332003 | 6 | 0 | A07CA00 | SAC | Include | 49.5 | 9.339622642 | 9.339622642 |
Accepted Solutions
- Mark as New
- Bookmark
- Subscribe
- Mute
- Subscribe to RSS Feed
- Permalink
- Report Inappropriate Content
fractile( TOTAL <ATCLevel5, PREPERATION,@5,@6,@7,@8,@9,@10> UnitPrice,0.6)
Works
- Mark as New
- Bookmark
- Subscribe
- Mute
- Subscribe to RSS Feed
- Permalink
- Report Inappropriate Content
It might be easy to help if you are able to provide a sample qvw file where you might be testing this and from that sample the expected output you are looking to get
- Mark as New
- Bookmark
- Subscribe
- Mute
- Subscribe to RSS Feed
- Permalink
- Report Inappropriate Content
Hi, Sunny
Thank you for the suggestion this is the out put i would like to be able to generate
| 8.496 | 63.01944107 | Max unit price based on ATC5 and Preperation | Include or exclude based on 60th Percentile | ||||||||||
| Acute GE | DYNAFORCE BLUEBERRY | 3000524001 | 12 | 0 | A07CA00 | SAC | Include | 98.02 | 8.168333333 | 8.168333333 | 9.33 | included | |
| Acute GE | DYNAFORCE CHERRY GRAPE | 3000527001 | 12 | 0 | A07CA00 | SAC | Include | 98.02 | 8.168333333 | 8.168333333 | 9.33 | included | |
| Acute GE | DYNAFORCE NAARTJIE | 3000525001 | 12 | 0 | A07CA00 | SAC | Include | 98.02 | 8.168333333 | 8.168333333 | 9.33 | included | |
| Acute GE | DYNAFORCE TROPICAL | 3000526001 | 12 | 0 | A07CA00 | SAC | Include | 98.02 | 8.168333333 | 8.168333333 | 9.33 | included | |
| Acute GE | NUDRATE BLACKCURRANT | 720393003 | 6 | 0 | A07CA00 | SAC | Include | 49.5 | 9.339622642 | 9.339622642 | 9.33 | excluded | |
| Acute GE | NUDRATE CITRUS | 718332003 | 6 | 0 | A07CA00 | SAC | Include | 49.5 | 9.339622642 | 9.339622642 | 9.33 | excluded |
- Mark as New
- Bookmark
- Subscribe
- Mute
- Subscribe to RSS Feed
- Permalink
- Report Inappropriate Content
Out of all the rows that are in the sample dashboard, you want to see just the 6 rows listed above? Or is this based on a selection. Still trying to understand the requirement a little better to help you out.
- Mark as New
- Bookmark
- Subscribe
- Mute
- Subscribe to RSS Feed
- Permalink
- Report Inappropriate Content
The six rows are just an example, there are hundreds of ATC5 ( ATC is a code for the active ingredient of a medication ) I need to be able to make a like for like comparison based on the unit price which is the strength of the drug( 50mg) divided by the price, I also need to group them by the presentation ( pills/solution/ointment etc) then include those drugs that cost below the 6Oth percentile of the maximum per unit cost or are the only drug with that particular ATC5 code and presentation .
So ideally it would be as follows
Unique Drug ATC5 Presentation Strength Price Unit Price Max Price Include
Bayer Disprin A07CA00 TAB 50mg $100 $2 /mg $4/mg Yes
Aspen Disprin A07CA00 TAB 100mg $225 $2.25 /mg $4/mg No
GSK Disprin A07CA00 TAB 50mg $200 $4 /mg $4/mg No
Augmentin A07CB01 Sol 100ml $200 $2/ml $2/ml Yes
Amoxicillin A07CB01 TAB 500mg $200 $0.4/mg $1/mg Yes
The drugs in red are comparable because they have the same class of ATC5 and presentation however Aspen Disprin is excluded because the cost falls above the 60th percentile of the maximum price
Blue and Green cant be compared because they have different presentation, and are the only drugs therefore they must both be included.
So in summary
Compare unit cost of like for like drugs based on ATC5 and presentation
Regards
Atila
- Mark as New
- Bookmark
- Subscribe
- Mute
- Subscribe to RSS Feed
- Permalink
- Report Inappropriate Content
Can you check if the attached is what you want
- Mark as New
- Bookmark
- Subscribe
- Mute
- Subscribe to RSS Feed
- Permalink
- Report Inappropriate Content
Hi, Sunny
Thanks, I appreciate the solution that you used. I was hoping to use a fractile function so that I get the bottom 60th percentile i.e. everything to the left, in some cases the price might be skewed
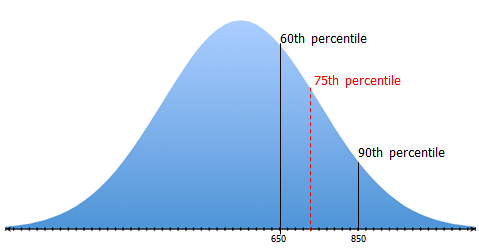
The issue with using 60% as a measure for the cut off means that when you have a unit price distribution like the graph below, you will end up with an unnecessary upper limit cost and potentially add all but 1 of the most expensive
Conversely if the graph was skewed to the left, you might include very expensive drugs, rather than just providing the most cost effective at the bottom end of the scale by using the factor of 0.6* max cost
Ideally I would want the following in terms of logic at least ( unfortunately it doesnt work in qlikview, I am not sure if i am missing some of the nuances around the fractile function)
If(UnitPrice < Fractile(Max(TOTAL <ATCLevel5, PREPERATION> UnitPrice),0.6), 'Include', 'Exclude')
- Mark as New
- Bookmark
- Subscribe
- Mute
- Subscribe to RSS Feed
- Permalink
- Report Inappropriate Content
fractile( TOTAL <ATCLevel5, PREPERATION,@5,@6,@7,@8,@9,@10> UnitPrice,0.6)
Works