Unlock a world of possibilities! Login now and discover the exclusive benefits awaiting you.
- Qlik Community
- :
- All Forums
- :
- QlikView App Dev
- :
- Vertical measures
- Subscribe to RSS Feed
- Mark Topic as New
- Mark Topic as Read
- Float this Topic for Current User
- Bookmark
- Subscribe
- Mute
- Printer Friendly Page
- Mark as New
- Bookmark
- Subscribe
- Mute
- Subscribe to RSS Feed
- Permalink
- Report Inappropriate Content
Vertical measures
Hello,
Is there a simple way to display vertically the measures in pivot table?
Instead of:
| Qty | Selling Price1 | Selling Price2 | Total Price | Avg | … |
| jan | 10 | 15 | 2 | 20 | 2 |
| feb | 10 | 20 | 2 | 20 | 2 |
I want:
| jan | feb | … |
| Qty | 10 | 10 |
| Selling Price1 | 15 | 20 |
| Selling Price2 | 2 | 2 |
| Total Price | 20 | 20 |
| Avg | 2 | 2 |
| … |
Thank you!
Accepted Solutions
- Mark as New
- Bookmark
- Subscribe
- Mute
- Subscribe to RSS Feed
- Permalink
- Report Inappropriate Content
Ok. now I understand what you meant. But there is no possibility to adjust the column-width in the way you want. You need to live with them (and maybe find a shorter expression-label) or as a workaround you enabled multiple rows and used a line-break within the expression-label.
- Marcus
- Mark as New
- Bookmark
- Subscribe
- Mute
- Subscribe to RSS Feed
- Permalink
- Report Inappropriate Content
You could drag the expressions like the dimensions within a pivot - within the expression-label press the left mouse-key and drag the expressions where you want.
- Marcus
- Mark as New
- Bookmark
- Subscribe
- Mute
- Subscribe to RSS Feed
- Permalink
- Report Inappropriate Content
Is this QlikView or Qlik Sense?
If it is QlikView then drag the expression label row to the left side so that it becomes a column and drag the month column to the top so that it becomes a row.
- Mark as New
- Bookmark
- Subscribe
- Mute
- Subscribe to RSS Feed
- Permalink
- Report Inappropriate Content
Thank you! It worked, but now I have another problem. I have a long text for measure label but the expresion result is not so big.
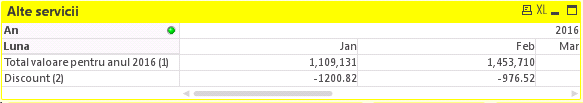
I want to resize only the amount, but I want to be able to see the entire label for the expresion.
How can I do that?
- Mark as New
- Bookmark
- Subscribe
- Mute
- Subscribe to RSS Feed
- Permalink
- Report Inappropriate Content
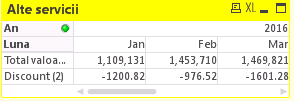
If you hover with the mouse over the edge from the columns you should get a small arrow-cross which you could click and by holding them you could size the columns smaller or wider.
- Marcus
- Mark as New
- Bookmark
- Subscribe
- Mute
- Subscribe to RSS Feed
- Permalink
- Report Inappropriate Content
It doesn't work in my case. I tried this, but when I resize the columns, it resizes the labels and vice versa.
- Mark as New
- Bookmark
- Subscribe
- Mute
- Subscribe to RSS Feed
- Permalink
- Report Inappropriate Content
It looked if you had applied the option of an unique column-width - therefore try it again. By a pivot-chart have only all columns of each single expression the same column-width - different expressions and the dimensions could have different column-widths:
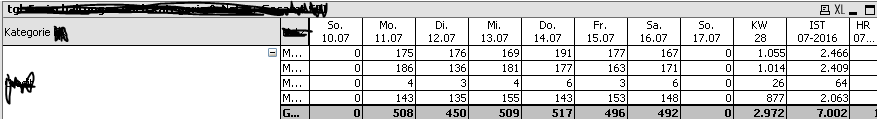
- Marcus
- Mark as New
- Bookmark
- Subscribe
- Mute
- Subscribe to RSS Feed
- Permalink
- Report Inappropriate Content
If I display expresions horizontal it works for me too, but when I drag them vertically it doesn't work.
- Mark as New
- Bookmark
- Subscribe
- Mute
- Subscribe to RSS Feed
- Permalink
- Report Inappropriate Content
Ok. now I understand what you meant. But there is no possibility to adjust the column-width in the way you want. You need to live with them (and maybe find a shorter expression-label) or as a workaround you enabled multiple rows and used a line-break within the expression-label.
- Marcus