Unlock a world of possibilities! Login now and discover the exclusive benefits awaiting you.
- Qlik Community
- :
- All Forums
- :
- QlikView App Dev
- :
- Visual Cues in Chart based on Chart Row
- Subscribe to RSS Feed
- Mark Topic as New
- Mark Topic as Read
- Float this Topic for Current User
- Bookmark
- Subscribe
- Mute
- Printer Friendly Page
- Mark as New
- Bookmark
- Subscribe
- Mute
- Subscribe to RSS Feed
- Permalink
- Report Inappropriate Content
Visual Cues in Chart based on Chart Row
Hi all,
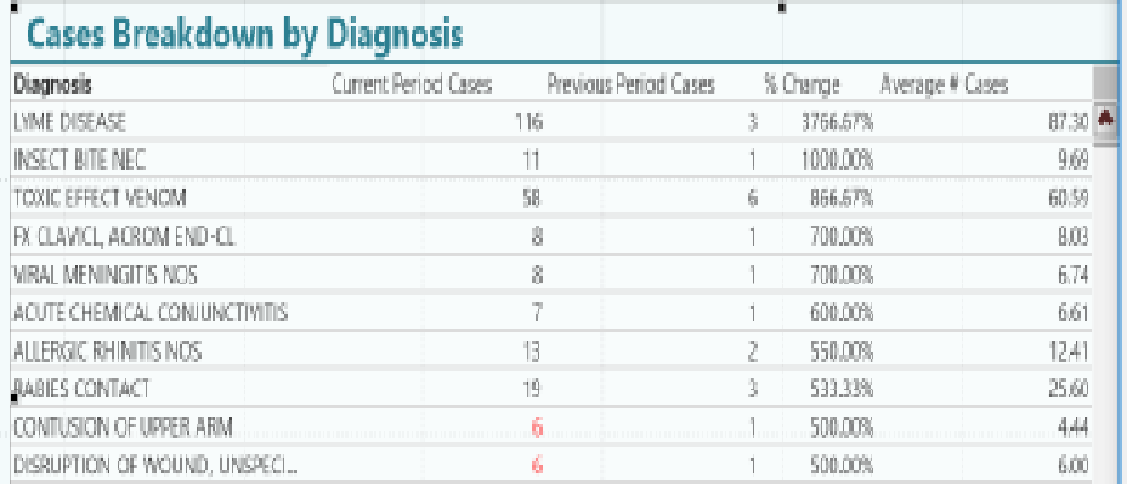
I have expressions that count the number of cases in the current period, the number of cases in the previous period, and the number of average cases over all time. I've put these expressions in a chart, and my dimension breaks the chart down by Diagnosis. I want to use visual cues to make a Current Period Cases row turn Green if it is greater than the average. So in my example above, the first row, is 116 current period cases, and the average is 87, so it would turn green.
I tried putting the expression for average cases into the visual cues, but it is comparing current period cases to the TOTAL average cases, not the average case per line in the chart. Does anyone know how to get it to compare it to the average per line?
Thanks!
Melissa
Accepted Solutions
- Mark as New
- Bookmark
- Subscribe
- Mute
- Subscribe to RSS Feed
- Permalink
- Report Inappropriate Content
May be use background color expression to get different colors.
- Mark as New
- Bookmark
- Subscribe
- Mute
- Subscribe to RSS Feed
- Permalink
- Report Inappropriate Content
May be use background color expression to get different colors.
- Mark as New
- Bookmark
- Subscribe
- Mute
- Subscribe to RSS Feed
- Permalink
- Report Inappropriate Content
No sorry, that doesn't work. It doesn't deem any of the values as true and is coloring them all the false color.
- Mark as New
- Bookmark
- Subscribe
- Mute
- Subscribe to RSS Feed
- Permalink
- Report Inappropriate Content
Hi Melissa,
Not necessarily this has to be achieved using the Visual cues. You can also use the background color option that appears under the expression. Below are the steps to do the same.
1. Go to the properties of the table.
2. Expand the expression "Current Period Cases".
3. Select "Background Color" from the list.
4. Enter the expression,
if([Current Period Cases]>=[Average # Cases], Green(), Red())
Hope this helps.
- Mark as New
- Bookmark
- Subscribe
- Mute
- Subscribe to RSS Feed
- Permalink
- Report Inappropriate Content
Would you be able to share a sample? or at least share the expression you tried?
- Mark as New
- Bookmark
- Subscribe
- Mute
- Subscribe to RSS Feed
- Permalink
- Report Inappropriate Content
Hi Melissa,
Pfa sample. Hope this is what your looking for .
Regards
KC
KC
- Mark as New
- Bookmark
- Subscribe
- Mute
- Subscribe to RSS Feed
- Permalink
- Report Inappropriate Content
Would you got solution or else try with ColorMax2() function
- Mark as New
- Bookmark
- Subscribe
- Mute
- Subscribe to RSS Feed
- Permalink
- Report Inappropriate Content
I went back and tried again and got it to work by adding the Num() around the second portion of the equation. I am not sure why that helped, though.
This worked:
If($(mEDVisitVolumeDateParameter(Date={">=$(=date($(=zFlexibleDateInterval1)))<=$(=date(vAsOfDate))"}))>Num($(mEDVisitVolume)/($(mDaysInPeriod)/$(mDaysInPeriodCompareCurrent)),'##.##'),red(),green())
I previously was trying this and it wasn't working:
If($(mEDVisitVolumeDateParameter(Date={">=$(=date($(=zFlexibleDateInterval1)))<=$(=date(vAsOfDate))"}))>$(mEDVisitVolume)/($(mDaysInPeriod)/$(mDaysInPeriodCompareCurrent)),red(),green())