Unlock a world of possibilities! Login now and discover the exclusive benefits awaiting you.
- Qlik Community
- :
- All Forums
- :
- QlikView App Dev
- :
- Re: Waterfall Help
- Subscribe to RSS Feed
- Mark Topic as New
- Mark Topic as Read
- Float this Topic for Current User
- Bookmark
- Subscribe
- Mute
- Printer Friendly Page
- Mark as New
- Bookmark
- Subscribe
- Mute
- Subscribe to RSS Feed
- Permalink
- Report Inappropriate Content
Waterfall Help
Good morning guys,
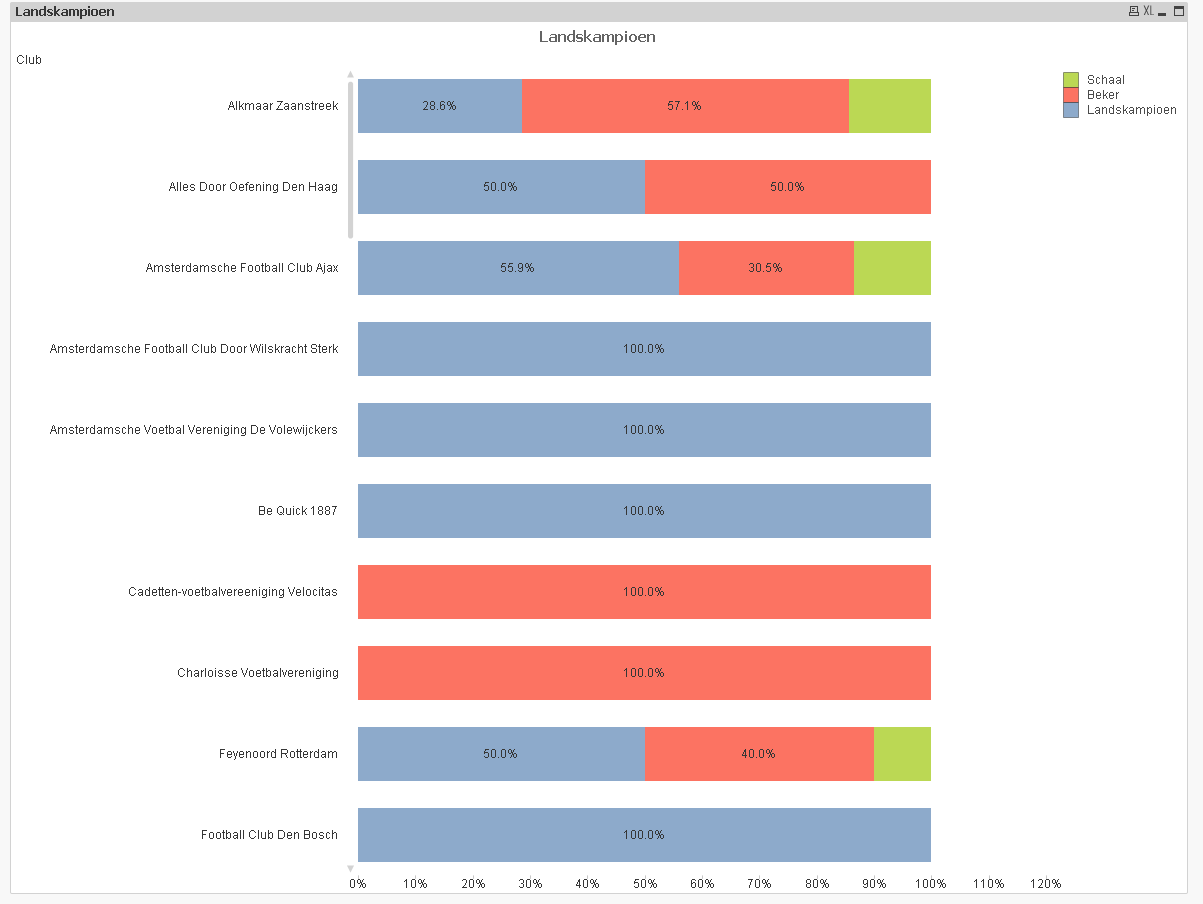
I have the attached data (and app). I am trying to show on a chart of some kind the total number of prizes each club has won, but then showing the number of Landskampioen, Beker or Schaal prizes won to comprise the total.
A colleague has suggested a waterfall chart may be the way to do this, but I haven't a clue how to do this or where to start.
Could one of you lovely people please help me? It might well be that a different type of chart is what I require.
Many thanks,
Gareth
Accepted Solutions
- Mark as New
- Bookmark
- Subscribe
- Mute
- Subscribe to RSS Feed
- Permalink
- Report Inappropriate Content
- Mark as New
- Bookmark
- Subscribe
- Mute
- Subscribe to RSS Feed
- Permalink
- Report Inappropriate Content
Hi Gareth,
Please Refer below thread you can get idea about this.
Regards
Sathish
- Mark as New
- Bookmark
- Subscribe
- Mute
- Subscribe to RSS Feed
- Permalink
- Report Inappropriate Content
Hi,
Please see the attached file.
BR<
Neha
- Mark as New
- Bookmark
- Subscribe
- Mute
- Subscribe to RSS Feed
- Permalink
- Report Inappropriate Content
Please check this
- Mark as New
- Bookmark
- Subscribe
- Mute
- Subscribe to RSS Feed
- Permalink
- Report Inappropriate Content
Thanks,
I understand what you've done with this. I don't think this is suitable for what I need in my work scenario.
What would be the best way to interpret the attached data as a visual?
I want to see both the Receipted and Retrospective scores as a composition of the Overall score.
I know what needs to be visible, but I am just not sure about what format this should be in. I attach a simplistic mock up of the kind of thing I'm trying to achieve.
Many thanks,
Gareth
- Mark as New
- Bookmark
- Subscribe
- Mute
- Subscribe to RSS Feed
- Permalink
- Report Inappropriate Content
Is this what you want?