Unlock a world of possibilities! Login now and discover the exclusive benefits awaiting you.
- Qlik Community
- :
- All Forums
- :
- QlikView App Dev
- :
- Weird issue on legend in bar chart
- Subscribe to RSS Feed
- Mark Topic as New
- Mark Topic as Read
- Float this Topic for Current User
- Bookmark
- Subscribe
- Mute
- Printer Friendly Page
- Mark as New
- Bookmark
- Subscribe
- Mute
- Subscribe to RSS Feed
- Permalink
- Report Inappropriate Content
Weird issue on legend in bar chart
Hi,
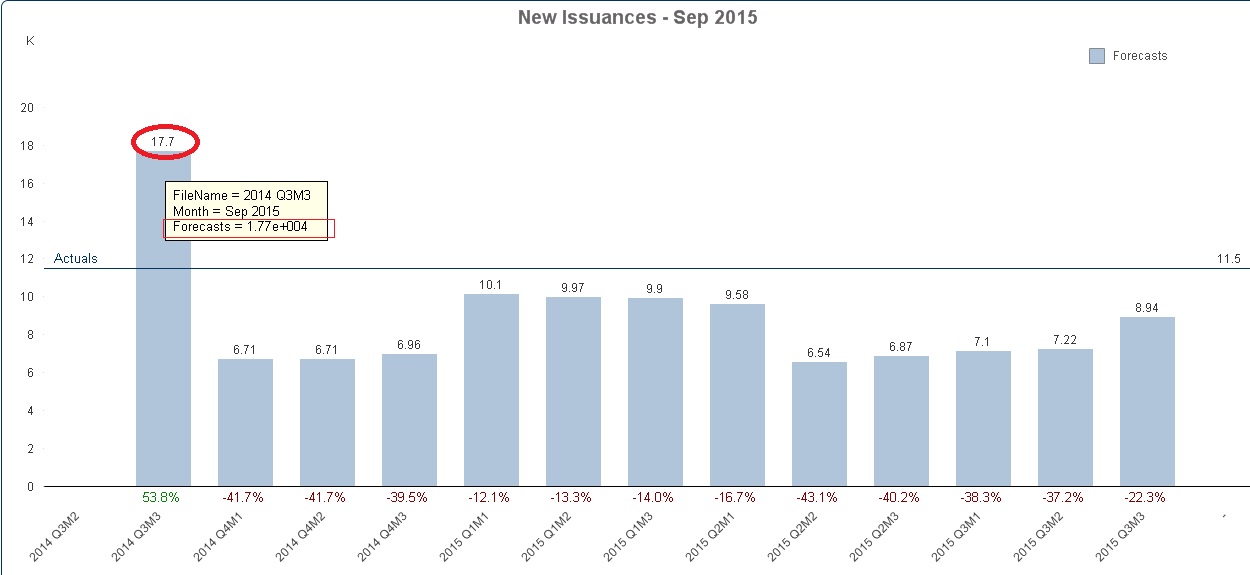
When I put the cursor on the bar in my bar chart, it shows the value as 11.5 but on the values on data point its displaying as 0.0115.
The value is being calculated from this expression: $(vLogFn(sum([New Issuance])))
where vLogFn : pick(floor(log10(fabs($1))/3)+1, num($1, '#,##0.'), num($1/1000, '###K'),num($1/1000000, '###M'),num($1/1000000000, '###B'))
Any help, much appreciated?
Regards,
Sachin
- Tags:
- new_to_qlikview
- Mark as New
- Bookmark
- Subscribe
- Mute
- Subscribe to RSS Feed
- Permalink
- Report Inappropriate Content
I often find it easier to diagnose things like this by temporarily changing the Chart to a Straight Table. Then I can really see what is happening and also add diagnostic expressions.
- Mark as New
- Bookmark
- Subscribe
- Mute
- Subscribe to RSS Feed
- Permalink
- Report Inappropriate Content
Thanks Bill I don't know what was the issue. But I used a dual function:
dual($(vLogFn(sum([New Issuance]))),sum([New Issuance]))
And it worked.
- Mark as New
- Bookmark
- Subscribe
- Mute
- Subscribe to RSS Feed
- Permalink
- Report Inappropriate Content
Isn't that because your y-axis is set to show values in Thousands (see the 'k' at the upper left)?
So the height of the bar would be 0.0115 (in k), the value is 11.5.
- Mark as New
- Bookmark
- Subscribe
- Mute
- Subscribe to RSS Feed
- Permalink
- Report Inappropriate Content
No, I don't think that's the issue Stefan.
I used a dual function:
dual($(vLogFn(sum([New Issuance]))),sum([New Issuance]))
And it worked.
- Mark as New
- Bookmark
- Subscribe
- Mute
- Subscribe to RSS Feed
- Permalink
- Report Inappropriate Content
Bill,
Any idea why forecast values are being shown in exponential format?
- Mark as New
- Bookmark
- Subscribe
- Mute
- Subscribe to RSS Feed
- Permalink
- Report Inappropriate Content
Hi Stefan,
Any idea why forecast values are being shown in exponential format.

- Mark as New
- Bookmark
- Subscribe
- Mute
- Subscribe to RSS Feed
- Permalink
- Report Inappropriate Content
Would you be able to share a sample QVW (could contain mock up data)?