Unlock a world of possibilities! Login now and discover the exclusive benefits awaiting you.
- Qlik Community
- :
- All Forums
- :
- QlikView App Dev
- :
- What function is used to aggregate the row (column...
- Subscribe to RSS Feed
- Mark Topic as New
- Mark Topic as Read
- Float this Topic for Current User
- Bookmark
- Subscribe
- Mute
- Printer Friendly Page
- Mark as New
- Bookmark
- Subscribe
- Mute
- Subscribe to RSS Feed
- Permalink
- Report Inappropriate Content
What function is used to aggregate the row (column)
Excuse me !
What function is used to aggregate the row (column), for example
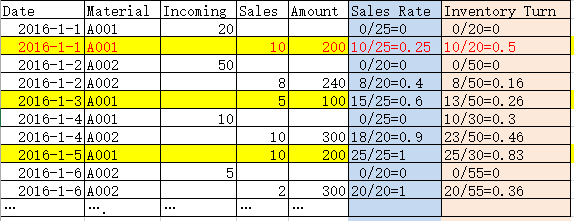
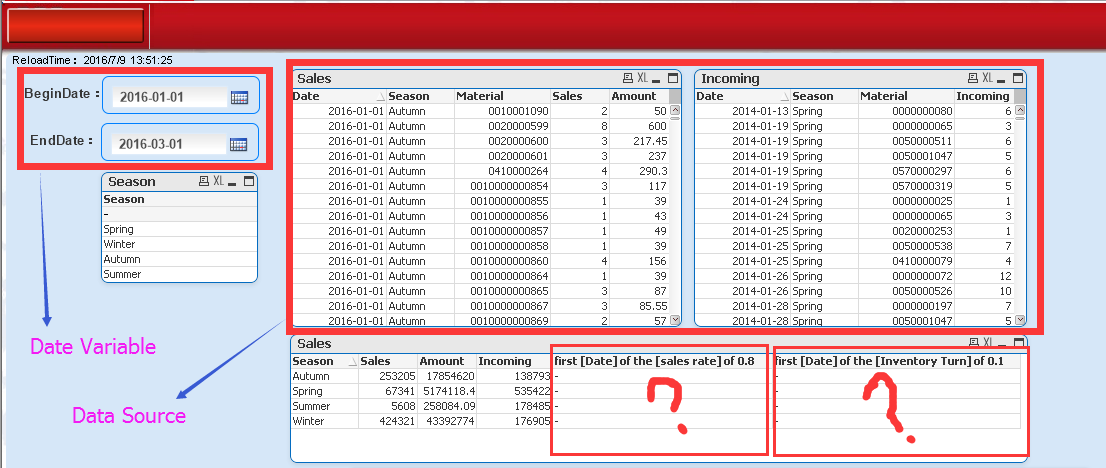
Returns the first [Date] of the [sales rate] of 0.8 ( note: Date is Variable)
Such as A001 : Return [2016-1-5]
A002 : Return [2016-1-4]
Returns the first [Date] of the [Inventory Turn] of 0.1 ( note: Date also is Variable)
Such as A001 : Return [2016-1-1]
A002 : Return [2016-1-2]
How to find out these “first [Date]”?????
- « Previous Replies
-
- 1
- 2
- Next Replies »
- Mark as New
- Bookmark
- Subscribe
- Mute
- Subscribe to RSS Feed
- Permalink
- Report Inappropriate Content
Where are you trying to get this information? In a chart? text box object?
- Mark as New
- Bookmark
- Subscribe
- Mute
- Subscribe to RSS Feed
- Permalink
- Report Inappropriate Content
Thanks Sunny T
Chart Type:
pivot table or Straight table
- Mark as New
- Bookmark
- Subscribe
- Mute
- Subscribe to RSS Feed
- Permalink
- Report Inappropriate Content
Would you be able to draw me a table here with the output you are looking to see?
- Mark as New
- Bookmark
- Subscribe
- Mute
- Subscribe to RSS Feed
- Permalink
- Report Inappropriate Content
Ok, Just a minute!
- Mark as New
- Bookmark
- Subscribe
- Mute
- Subscribe to RSS Feed
- Permalink
- Report Inappropriate Content
Hi
Do you need
dates accordingly the first maximum, second maximum.......... of sales rate ,
and
dates accordingly the first maximum, second maximum......... of Inventrory Turn
- Mark as New
- Bookmark
- Subscribe
- Mute
- Subscribe to RSS Feed
- Permalink
- Report Inappropriate Content
- Mark as New
- Bookmark
- Subscribe
- Mute
- Subscribe to RSS Feed
- Permalink
- Report Inappropriate Content
Can you attach the qvw file?
- Mark as New
- Bookmark
- Subscribe
- Mute
- Subscribe to RSS Feed
- Permalink
- Report Inappropriate Content
Thanks Sunny T
- Mark as New
- Bookmark
- Subscribe
- Mute
- Subscribe to RSS Feed
- Permalink
- Report Inappropriate Content
Is this what you wanted?
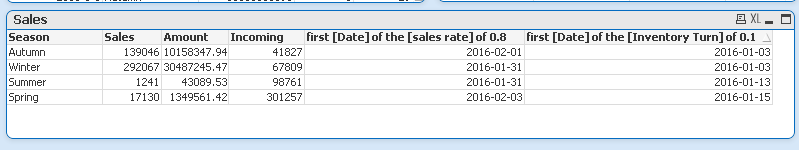
Expressions used:
Min(Aggr(If(RangeSum(Above(Sum(Sales), 0, RowNo()))/Sum(TOTAL <Season> Sales) >= 0.80, SalesDate), Season, SalesDate))
Min(Aggr(If(RangeSum(Above(Sum(Sales), 0, RowNo()))/Sum(TOTAL <Season> Sales) >= 0.10, SalesDate), Season, SalesDate))
Not sure if this is your real data or not, but this may or may not work for your actual data because of the usage of Aggr() function. This worked for the sample because the data seems to be all well sorted, but if you are using QV 12 or above, you will be able to use The sortable Aggr function is finally here! which might solve your problem in your real data (if it comes up).
Let me know if this is not what you were looking for.
Best,
Sunny
- « Previous Replies
-
- 1
- 2
- Next Replies »