Unlock a world of possibilities! Login now and discover the exclusive benefits awaiting you.
- Qlik Community
- :
- All Forums
- :
- QlikView App Dev
- :
- Re: Where can I change the default Bar Chart colou...
- Subscribe to RSS Feed
- Mark Topic as New
- Mark Topic as Read
- Float this Topic for Current User
- Bookmark
- Subscribe
- Mute
- Printer Friendly Page
- Mark as New
- Bookmark
- Subscribe
- Mute
- Subscribe to RSS Feed
- Permalink
- Report Inappropriate Content
Where can I change the default Bar Chart colour by IDs?
I know that one can change it in the Color tab. But how and where can I change the Colour of my Bar Chart on ID e.g. Supplier level. Thank you!
- « Previous Replies
-
- 1
- 2
- Next Replies »
- Mark as New
- Bookmark
- Subscribe
- Mute
- Subscribe to RSS Feed
- Permalink
- Report Inappropriate Content
You might try creating the RGB values of your colour palette as a standalone field in your data model and then use the FieldValue() function to call out the required value. Using the example above it might look like...
FieldValue('Colour Palette', FieldIndex('field',field))
- Mark as New
- Bookmark
- Subscribe
- Mute
- Subscribe to RSS Feed
- Permalink
- Report Inappropriate Content
Hi Adam,
Thanks for your reply.
I am trying that but facing some issues.
You mean if I use
FieldValue('Colour Palette',fieldindex( $(=chr(39) & GetCurrentField([Cyclic_Dims]) & chr(39) ), $(='[' & GetCurrentField([Cyclic_Dims]) & ']' ) ))
This should give me the colors as defined in color palette. but not working as expected.
can you help me on this.
Thanks
Khushboo
- Mark as New
- Bookmark
- Subscribe
- Mute
- Subscribe to RSS Feed
- Permalink
- Report Inappropriate Content
My guess would be that your dollar expansions are not working as expected. Break down each part of the expression into individual text boxes to see what response they are giving you. Might also be a good idea to test out the general idea on a much simplified app to make sure that the theory is sound.
- Mark as New
- Bookmark
- Subscribe
- Mute
- Subscribe to RSS Feed
- Permalink
- Report Inappropriate Content
Hi Adam,
Thanks for your reply.
I am trying that but facing some issues.
You mean if I use
FieldValue('Colour Palette',fieldindex( $(=chr(39) & GetCurrentField([Cyclic_Dims]) & chr(39) ), $(='[' & GetCurrentField([Cyclic_Dims]) & ']' ) ))
This should give me the colors as defined in color palette. but not working as expected.
can you help me on this.
Thanks
Khushboo
- Mark as New
- Bookmark
- Subscribe
- Mute
- Subscribe to RSS Feed
- Permalink
- Report Inappropriate Content
I've been playing around with this. Given a field of 'Person' and a Palette field of 'Palette' the following expression returns the correct RGB values
=FieldValue('Palette', FieldIndex('Person', Person))
However, this is then not being applied correctly as a background colour in the chart. Here I have assigned the expression as a background colour and as text on the data point.
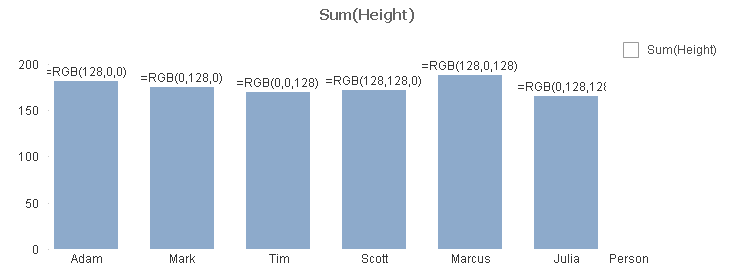
Not sure where to go from here.
- Mark as New
- Bookmark
- Subscribe
- Mute
- Subscribe to RSS Feed
- Permalink
- Report Inappropriate Content
Did you try to use Multicolored option?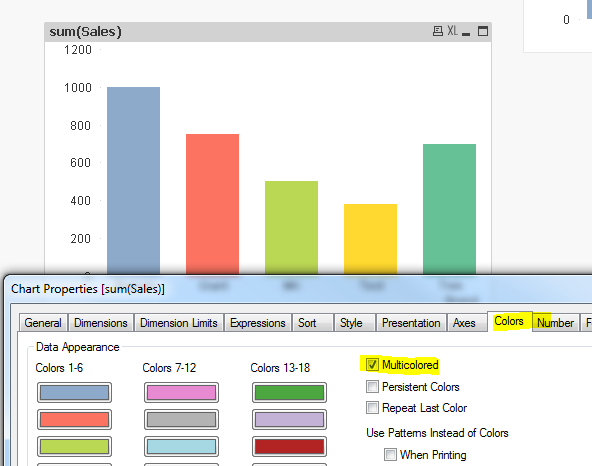
I'm not sure if that will help as I have no idea how many dimension you are using etc.
- « Previous Replies
-
- 1
- 2
- Next Replies »