Unlock a world of possibilities! Login now and discover the exclusive benefits awaiting you.
- Qlik Community
- :
- All Forums
- :
- QlikView App Dev
- :
- Re: Wrong Pivot Table Values
- Subscribe to RSS Feed
- Mark Topic as New
- Mark Topic as Read
- Float this Topic for Current User
- Bookmark
- Subscribe
- Mute
- Printer Friendly Page
- Mark as New
- Bookmark
- Subscribe
- Mute
- Subscribe to RSS Feed
- Permalink
- Report Inappropriate Content
Wrong Pivot Table Values
Hi community,
I have a new problem in my dashboard, when I enable the "Show Partial Sums" in the Presentation Tab in my Chart Properties, I get a wrong value. In the snapshot bellow you can see it clearly that there is something wrong with the value:
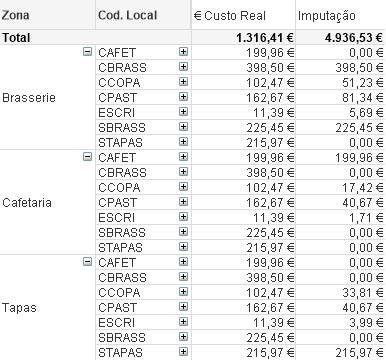
My dimensions are:
- [Zona]
- [CodLocal] labeled as [Cod. Local]
- [CodEmpregado] labeled as [Cod. Funcionário]
My expressions are:
- =sum(CustoReal) -> labeled as [€ Custo Real]
- =sum(CustoReal)*num(sum({$<Zona=, CodLocal=, CodEmpregado=, data= >} DISTINCT Imputacao%)) -> labeled as [Imputação]
The [Imputacao%] values table:
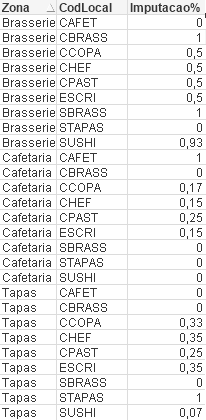
What is the changes that I need to make to get the correct output result (1 316,41 €) for the totals of [Imputação] and (3 949,22 €)?
Can you experts help me? hicgwassenaarsunindiajontydkpi can you help me? Anyone?
If anyone needs further more explanation, please ask it in the comment section bellow.
Regards,
MB
- « Previous Replies
-
- 1
- 2
- Next Replies »
- Mark as New
- Bookmark
- Subscribe
- Mute
- Subscribe to RSS Feed
- Permalink
- Report Inappropriate Content
This was the solution that I could by myself get:

With the expressions be like:
- %Imputação -> =Sum(Imputacao%)
- € Imputação -> =Sum(Aggr(((tempo*1440)/60)*(ValorHora)*(Imputacao%), Zona, CodLocal, [CodEmpregado], [DataHora], [Saída]))
- € Custo Real -> =Sum(Aggr(((tempo*1440)/60)*(ValorHora), Zona, CodLocal, [CodEmpregado], [DataHora], [Saída]))
Hope someone find a similar problem in the future and that this answers may give you a similar solution. Have fun and good job people 
- « Previous Replies
-
- 1
- 2
- Next Replies »