Unlock a world of possibilities! Login now and discover the exclusive benefits awaiting you.
- Qlik Community
- :
- All Forums
- :
- QlikView App Dev
- :
- Re: Wrong Total in table
- Subscribe to RSS Feed
- Mark Topic as New
- Mark Topic as Read
- Float this Topic for Current User
- Bookmark
- Subscribe
- Mute
- Printer Friendly Page
- Mark as New
- Bookmark
- Subscribe
- Mute
- Subscribe to RSS Feed
- Permalink
- Report Inappropriate Content
Wrong Total in table
Hi All,
Need help in getting the correct total on my pivot table.
my table sums source and usage needs by part code and groups, it looks like that
| Group | Part Code | Source | Usage |
|---|---|---|---|
| 1 | 11 | 5 | 0 |
| 1 | 12 | 3 | 5 |
| 1 | 13 | 8 | 4 |
| Total | 11 | ||
| 2 | 21 | 9 | 7 |
| 2 | 22 | 20 | 10 |
| 2 | 23 | 14 | 0 |
| Total | 43 | ||
I'm trying to calculate source value only if usage >0 , my syntax looks like:
if([Usage]>0,Sum(source))
my table doesn't show rows where Usage=0 but it calculates total for those rows
i want to calculate total of group source if usage>0 , the problem is that instead of total value like Group 1, i get total value like Group 2
thanks for any help
avner
- Mark as New
- Bookmark
- Subscribe
- Mute
- Subscribe to RSS Feed
- Permalink
- Report Inappropriate Content
Maybe this is what you are trying to get:
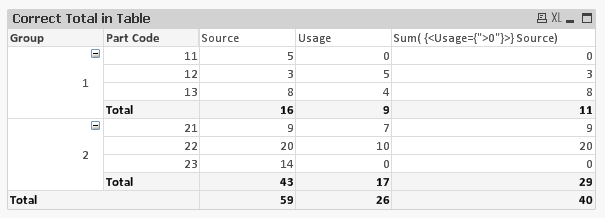
I made an extra column/expression to show how a set expression can be used in a Sum() to filter out all values where Usage=0 thus keeping those that are greater than 0 (actually maybe is should be all not equal to 0) ...
Hope this helps...
- Mark as New
- Bookmark
- Subscribe
- Mute
- Subscribe to RSS Feed
- Permalink
- Report Inappropriate Content
hi Petter,
thanks for your reply but Usage is a column title, and doesn't seem to act as a dimension in set analysis.
b.t.w the data in "Usage" comes from a different table from the data in "Source"
- Mark as New
- Bookmark
- Subscribe
- Mute
- Subscribe to RSS Feed
- Permalink
- Report Inappropriate Content
Actually set expressions doesn't care if anything is a measure or a dimension. Anyway Usage in the sample I used is not a dimension either. There is no need for "Usage" and "Source" to be in the same table - but they should be associated appropriately so you don't get a cartesian join....
If you provide your data / data model or some representative sample of it it could be easier to help you solve this.
best regards
Petter Skjolden