Unlock a world of possibilities! Login now and discover the exclusive benefits awaiting you.
- Qlik Community
- :
- All Forums
- :
- QlikView App Dev
- :
- YTD and MTD in dimensions
- Subscribe to RSS Feed
- Mark Topic as New
- Mark Topic as Read
- Float this Topic for Current User
- Bookmark
- Subscribe
- Mute
- Printer Friendly Page
- Mark as New
- Bookmark
- Subscribe
- Mute
- Subscribe to RSS Feed
- Permalink
- Report Inappropriate Content
YTD and MTD in dimensions
Hi Team,
Hope all are doing good.
I need help on YTD and MTD functionality to work for dimensions.
I have few dimensions added to the straight table and i need to display dimension values with ytd and mtd logic.I hvae added one expression with ytd and mtd logic and hided that column as it is not required to display on the chart but its not giving correct results.
Please help on this regard...
Thanks,
Nani
- Tags:
- new_to_qlikview
- « Previous Replies
-
- 1
- 2
- Next Replies »
- Mark as New
- Bookmark
- Subscribe
- Mute
- Subscribe to RSS Feed
- Permalink
- Report Inappropriate Content
this is like if i select jan and ytd in filters it has to display list of customers in jan,
if i select feb and ytd in filters it has to display customers from jan and feb.
Thanks,
Nani
- Mark as New
- Bookmark
- Subscribe
- Mute
- Subscribe to RSS Feed
- Permalink
- Report Inappropriate Content
Can you share your application or some sample data with the expected output?
- Mark as New
- Bookmark
- Subscribe
- Mute
- Subscribe to RSS Feed
- Permalink
- Report Inappropriate Content
Hi Sunindia,
Please find the attached file.
If i select jan i shoul get only a,
if b i have to show a,b,
if c i have to show a,b,c
if d i have to show a,b,c,d
Thanks,
Nani
- Mark as New
- Bookmark
- Subscribe
- Mute
- Subscribe to RSS Feed
- Permalink
- Report Inappropriate Content
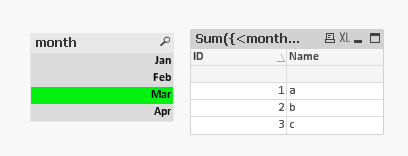
Please see attached, changed the script to make month a true month field using date function:
Table:
LOAD ID,
Name,
Month(Date#(month, 'MMM')) as month,
sale;
LOAD * INLINE [
ID, Name, month,sale
1, a, Jan ,100
2, b, Feb,200
3, c, Mar,300
4, d, Apr,400
];
Expression changed to: Sum({<month = {"$(='<=' & Max(month))"}>}sale)
Output:
Also attaching your qvw document for reference.
HTH
Best,
Sunny
- Mark as New
- Bookmark
- Subscribe
- Mute
- Subscribe to RSS Feed
- Permalink
- Report Inappropriate Content
You can try with a flags calendar. You will take a master Date and a flag date, where the Master Date y your master calendar and the flag date is a date that you can use for asociate to YTD flag, MTD Flag.
i.e.
Master Date Flag Date YTD_Flag
201501 201501 1
201501 201502 0
201501 201503 0
201501 201504 0
201501 201505 0
201501 201506 0
201502 201501 1
201502 201502 1
201502 201503 0
201502 201504 0
201502 201505 0
201502 201506 0
201503 201501 1
201503 201502 1
201503 201503 1
201503 201504 0
201503 201505 0
201503 201506 0
201504 201501 1
201504 201502 1
201504 201503 1
201504 201504 1
201504 201505 0
201504 201506 0
So if you want to see the YTD for 201403 you can see the Flag Date that has a value of 1 in the flag.
- Mark as New
- Bookmark
- Subscribe
- Mute
- Subscribe to RSS Feed
- Permalink
- Report Inappropriate Content
Hi Sunny,
Thanks for your work but in my scenario i have added the same logic for mtd and ytd
but im not getting the values as expected.Do i need to do something else to get the ytd and mtd functionality to work for dimention values.
- Mark as New
- Bookmark
- Subscribe
- Mute
- Subscribe to RSS Feed
- Permalink
- Report Inappropriate Content
Yes for YTD you can use a expression like this:
=Sum({<Date = {"$(='>=' & Date(YearStart(Max(Date))) & '<=' & Date(Max(Date)))"}>}sale)
for MTD
=Sum({<Date = {"$(='>=' & Date(MonthStart(Max(Date))) & '<=' & Date(Max(Date)))"}>}sale)
- Mark as New
- Bookmark
- Subscribe
- Mute
- Subscribe to RSS Feed
- Permalink
- Report Inappropriate Content
Or if you can create a field in the script:
MonthName(Date) as MonthYear you can do this also:
For YTD
=Sum({<MonthYear = {"$(='>=' & MonthName(YearStart(Max(MonthYear))) & '<=' & MonthName(Max(MonthYear)))"}>}sale)
for MTD
=Sum({<MonthYear = {"$(=MonthName(Max(MonthYear)))"}>}sale)
- Mark as New
- Bookmark
- Subscribe
- Mute
- Subscribe to RSS Feed
- Permalink
- Report Inappropriate Content
I have taken the same expression which i have used in my KPI's for ytd and mtd logic
- « Previous Replies
-
- 1
- 2
- Next Replies »