Unlock a world of possibilities! Login now and discover the exclusive benefits awaiting you.
- Qlik Community
- :
- All Forums
- :
- QlikView App Dev
- :
- Year Reported & Year Closed in Single List box
- Subscribe to RSS Feed
- Mark Topic as New
- Mark Topic as Read
- Float this Topic for Current User
- Bookmark
- Subscribe
- Mute
- Printer Friendly Page
- Mark as New
- Bookmark
- Subscribe
- Mute
- Subscribe to RSS Feed
- Permalink
- Report Inappropriate Content
Year Reported & Year Closed in Single List box
Hello All,
In an incident dump, we have incidents reported for the month of Jan 2015. [Reported Date Column]
Also the incidents closed for the month Jan 2015 which can be created in 2014 & Jan 2015 also.[Completed Date Column]
Now i need to have a list box of years 2014 2015 . selecting 2015 should show the Incidents Reported & Incident Closed in the Bar Chart.
Reported Date & Completed Date are two different columns.
How can i have the list box of Year which should take care of both [Incident Reported & Incident Closed].
Can you please suggest me. Appreciate your valued response.
Thanks,
Sasikumar
- Tags:
- new_to_qlikview
- Mark as New
- Bookmark
- Subscribe
- Mute
- Subscribe to RSS Feed
- Permalink
- Report Inappropriate Content
Hi,
Solution will be Here ,i assume its same requirement.
- Mark as New
- Bookmark
- Subscribe
- Mute
- Subscribe to RSS Feed
- Permalink
- Report Inappropriate Content
Hello,
My Edit Script:
SR:
LOAD [SR Number],
Title,
Category,
Status,
Impact,
Priority,
Department,
Requestor,
[Approved by],
Team,
Application,
[Team Manager],
[Assigned to],
VP,
[Created by],
Requested,
Approved,
Initiated,
Completed,
Year(Approved) as YearOpen,
Month(Approved) as MonthOpen,
Year(Completed) as YearClose,
Month(Completed) as MonthClose
FROM Table;
-- Here you can see Approved column as YearOpen, MonthOpen
Completed Column as YearClose, MonthClose.
The Open is correct which is 73.
But the closed count should be 124
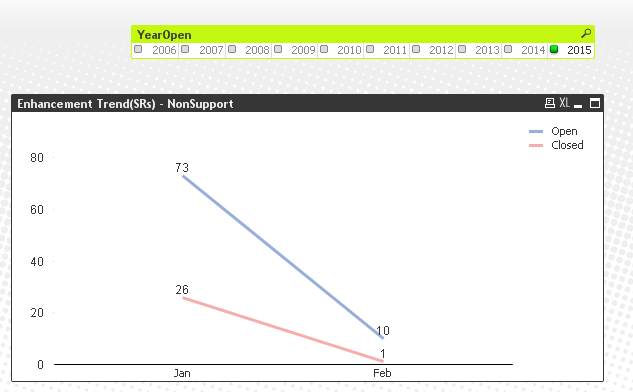
Steps used to create
1) Dimension - MonthOpen
2)Expression- For Open
Sum({<[Category]-={Support},Status = {'Accepted','Completed','In Progress','On Hold','Pending AD Approval'}>}[MonthOpen])
3)Expression - For Closed,
Sum({<[Category]-={Support},Status = {'Accepted','Completed','In Progress','On Hold','Pending AD Approval'}>}[MonthClose])
Please suggest me. Thanks in Advance