Unlock a world of possibilities! Login now and discover the exclusive benefits awaiting you.
- Qlik Community
- :
- All Forums
- :
- QlikView App Dev
- :
- Re: Year & Values in Bar chart and Staright table ...
- Subscribe to RSS Feed
- Mark Topic as New
- Mark Topic as Read
- Float this Topic for Current User
- Bookmark
- Subscribe
- Mute
- Printer Friendly Page
- Mark as New
- Bookmark
- Subscribe
- Mute
- Subscribe to RSS Feed
- Permalink
- Report Inappropriate Content
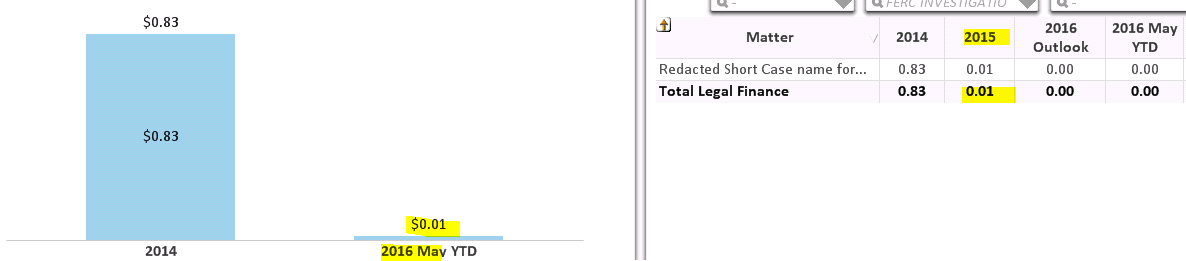
Year & Values in Bar chart and Staright table DONOT match when a selection is made in staright table
Hi,
I have a Bar chart and a straight table displaying same data.
when I make selection in straight table, the values in the bar chart are not matching with straight table.
In below screenshot, Bar chart has 0.83 for 2014 where as straight table has that value for 2015.
When I don't make any selections in Straight table both charts are matching.Attached is the qvw.
Can someone please help me ASAP. Thanks!

- Mark as New
- Bookmark
- Subscribe
- Mute
- Subscribe to RSS Feed
- Permalink
- Report Inappropriate Content
Your table expression for 2015 is:
=(sum({<Year= {$(=Max(Year)-1) },SPENDTYPE -= {'ARIBA'}>}SPEND/1000000))
but the label for that expression is:
=Max({1}(Year)-1)
The label is ignoring selections (giving 2015), but the expression is not ignoring selections (giving the sum for 2014).
Perhaps change your expressions to match the labels:
=(sum({<Year= {$(=Max({1}Year)-1) },SPENDTYPE -= {'ARIBA'}>}SPEND/1000000))
- Mark as New
- Bookmark
- Subscribe
- Mute
- Subscribe to RSS Feed
- Permalink
- Report Inappropriate Content
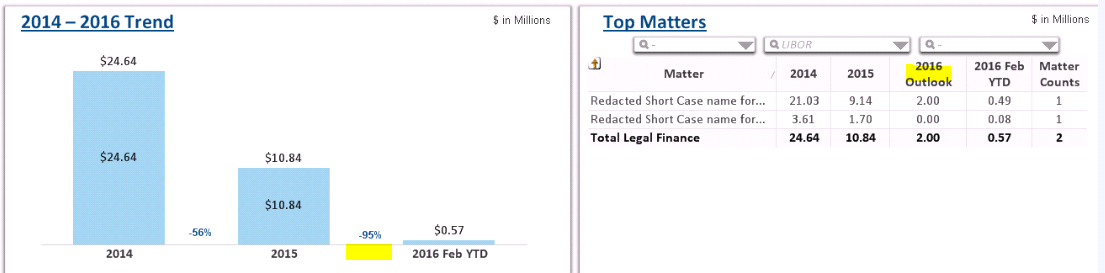
Looks like it is working, but I have noticed another issue. 
When I select a name in straight table, I see data for 4years in straight table but in Bar chart I see data only for 3years.
I have to fix this today, Can someone please help me ASAP. I have attached the qvw to the original discussion. Thanks!
- Mark as New
- Bookmark
- Subscribe
- Mute
- Subscribe to RSS Feed
- Permalink
- Report Inappropriate Content
Hi m w,
I tried changing expressions to match the labels and it didn't work. It fixed 2014 numbers but now I see ame issue with 2015 & 2016 numbers. Can you please help me fix this. Thanks!
In below screenshot, Bar chart has 0.01 for 2016 where as straight table has that value for 2015.