Unlock a world of possibilities! Login now and discover the exclusive benefits awaiting you.
- Qlik Community
- :
- All Forums
- :
- QlikView App Dev
- :
- Re: Year over Year Chart
- Subscribe to RSS Feed
- Mark Topic as New
- Mark Topic as Read
- Float this Topic for Current User
- Bookmark
- Subscribe
- Mute
- Printer Friendly Page
- Mark as New
- Bookmark
- Subscribe
- Mute
- Subscribe to RSS Feed
- Permalink
- Report Inappropriate Content
Year over Year Chart
Hello,
I would like to create a Year over Year chart (Per month basis). However, the data is a bit complicated. May I know what kind of method I can use for calculating the Year over Year based on below set of data. Thank you.
Date
01-05-2017
10-05-2017
18-06-2017
23-07-2017
03-05-2018
04-05-2018
21-05-2018
01-06-2018
03-06-2018
17-07-2018
18-07-2018
At the end, I would like to see the line chart comparison on the data over 2017 and 2018.
May 2017 - Total 2
June 2017 - Total 1
July 2017 - Total 1
May 2018 - Total 3
June 2018 - Total 2
July 2018 - Total 2
- Mark as New
- Bookmark
- Subscribe
- Mute
- Subscribe to RSS Feed
- Permalink
- Report Inappropriate Content
Would be able to elaborate a little more or provide a sample data and expected output 
I am not sure what Total 1/2 are..
- Mark as New
- Bookmark
- Subscribe
- Mute
- Subscribe to RSS Feed
- Permalink
- Report Inappropriate Content
Maybe something like this...?
DATA:
Load
Count(Value) as Count,
Month(Date2) as Month,
Year(Date2) as Year
Group By
Month(Date2),
Year(Date2);
Load *,
Date(Date#(Date,'DD-MM-YYYY'),'M/D/YYYY') as Date2;
Load * Inline [
Date, Value
01-05-2017, 10
10-05-2017, 12
18-06-2017, 15
23-07-2017, 9
03-05-2018, 7
04-05-2018, 11
21-05-2018, 10
01-06-2018, 6
03-06-2018, 5
17-07-2018, 17
18-07-2018, 15
];
Then make a line chart with dimension: Month
And expressions:
Sum ({<Year={$(=Max(Year))}>}Count) with label =Max(Year)
Sum ({<Year={$(=Max(Year)-1)}>}Count) with label =Max(Year)-1
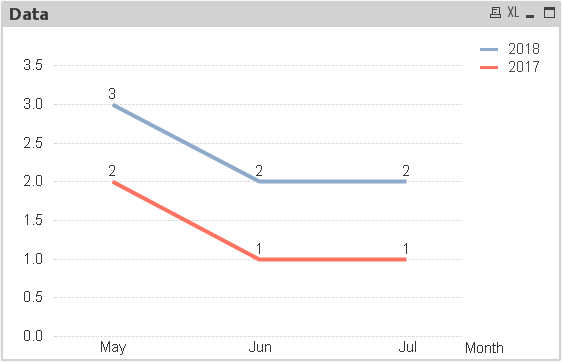
See attached.
HTH,
John
- Mark as New
- Bookmark
- Subscribe
- Mute
- Subscribe to RSS Feed
- Permalink
- Report Inappropriate Content
Look into RANGESUM(). This should be perfect for your issue.
- Mark as New
- Bookmark
- Subscribe
- Mute
- Subscribe to RSS Feed
- Permalink
- Report Inappropriate Content
It might if Rob was looking for the sum of the numeric values. What Rob is asking for is the number of occurrences.
Regards,
John