Unlock a world of possibilities! Login now and discover the exclusive benefits awaiting you.
- Qlik Community
- :
- All Forums
- :
- QlikView App Dev
- :
- a percent division for each date, not sum of all
- Subscribe to RSS Feed
- Mark Topic as New
- Mark Topic as Read
- Float this Topic for Current User
- Bookmark
- Subscribe
- Mute
- Printer Friendly Page
- Mark as New
- Bookmark
- Subscribe
- Mute
- Subscribe to RSS Feed
- Permalink
- Report Inappropriate Content
a percent division for each date, not sum of all
Hi everyone,
I think I've confused myself and I'm in need of help again. In the attached qlik file, you'll see the first chart (top left) as the count of some IDs, nothing special. The next chart is a sum of a particular count for the date that's the same as the first chart.
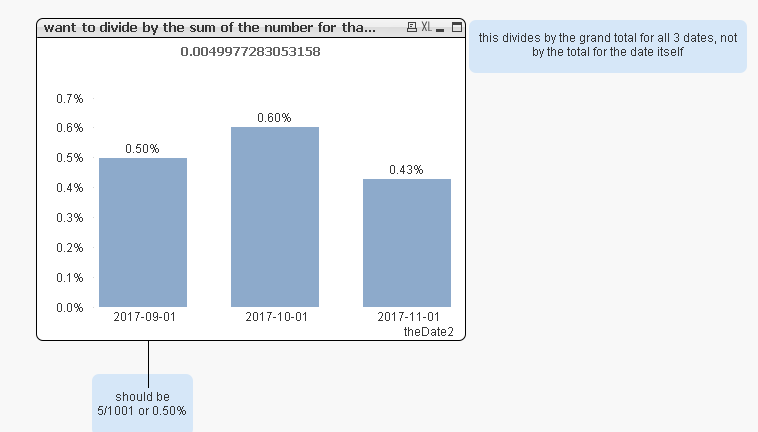
In the 3rd chart (below the other 2) you'll see I'm trying to do the division of (first chart)/(second chart), however because of the way the data is loaded, the chart is dividing by the sum of all the dates, rather than the sum for just 1 date each.
The solution I'm looking for, albeit perhaps counter-productive, should be within the way the data is loaded. I'm basically asking if it can be done, regardless if it's ideal.
Take a look at the qlik, and let me know if there are any questions.
thanks as always
- « Previous Replies
-
- 1
- 2
- Next Replies »
Accepted Solutions
- Mark as New
- Bookmark
- Subscribe
- Mute
- Subscribe to RSS Feed
- Permalink
- Report Inappropriate Content
May be this
=Count(DISTINCT ID)/Sum(DISTINCT If(theDate = theDate2, numbers))
I don't like this solution, but this is a temporary fix.... for long term, I would use a Canonical Date
- Mark as New
- Bookmark
- Subscribe
- Mute
- Subscribe to RSS Feed
- Permalink
- Report Inappropriate Content
Can you tell how did you get 1001 in your test file you attached?
- Mark as New
- Bookmark
- Subscribe
- Mute
- Subscribe to RSS Feed
- Permalink
- Report Inappropriate Content
The number is loaded inline, in this case the 1001 is the sum of the "numbers" field for that date (2 records, 1000 and 1), where "thing" is selected as BB
it's 500 for 2017-10-01, and 700 for 2017-11-01. Grand total being 2201, but I only care about the total for each date
- Mark as New
- Bookmark
- Subscribe
- Mute
- Subscribe to RSS Feed
- Permalink
- Report Inappropriate Content
But, in your first 2 charts there two different dimensions. Does this okay to you?s
- Mark as New
- Bookmark
- Subscribe
- Mute
- Subscribe to RSS Feed
- Permalink
- Report Inappropriate Content
Right, they are different dimensions... that's the tricky part. In the real data, there may be millions of records, for each of these tables. I basically want to say "where these dates equal each other, show me the ID(field of one table)/ numbers(field of another table)"
Perhaps there's a temp table solution that can be done in the script? Is there an easy way in the expression? I don't know, I'm too new at qlik and nothing I try works.
Thanks
- Mark as New
- Bookmark
- Subscribe
- Mute
- Subscribe to RSS Feed
- Permalink
- Report Inappropriate Content
May be this
=Count(DISTINCT ID)/Sum(DISTINCT If(theDate = theDate2, numbers))
I don't like this solution, but this is a temporary fix.... for long term, I would use a Canonical Date
- Mark as New
- Bookmark
- Subscribe
- Mute
- Subscribe to RSS Feed
- Permalink
- Report Inappropriate Content
Hi Sunny,
That's a good solution, even if you don't like it. I tried a way where I created a temp table and renamed the date the same, but that forced a synthetic table I didn't like.
I will use this idea and look into Canonical Date.
Thanks!
- Mark as New
- Bookmark
- Subscribe
- Mute
- Subscribe to RSS Feed
- Permalink
- Report Inappropriate Content
I know you already got the solution for this. However, may be thought this might help you in your future similar requests. Find attached the solution file implementing canonical dates written and explained by HIC.
- Mark as New
- Bookmark
- Subscribe
- Mute
- Subscribe to RSS Feed
- Permalink
- Report Inappropriate Content
Awesome vishsaggi, thanks for sharing this 
- Mark as New
- Bookmark
- Subscribe
- Mute
- Subscribe to RSS Feed
- Permalink
- Report Inappropriate Content
Thank you too Sunny for referring to Canonical Dates. It refreshed my concept too.
- « Previous Replies
-
- 1
- 2
- Next Replies »