Unlock a world of possibilities! Login now and discover the exclusive benefits awaiting you.
- Qlik Community
- :
- All Forums
- :
- QlikView App Dev
- :
- calculate axis labels based on custom condition
Options
- Subscribe to RSS Feed
- Mark Topic as New
- Mark Topic as Read
- Float this Topic for Current User
- Bookmark
- Subscribe
- Mute
- Printer Friendly Page
Turn on suggestions
Auto-suggest helps you quickly narrow down your search results by suggesting possible matches as you type.
Showing results for
Not applicable
2015-07-21
04:17 PM
- Mark as New
- Bookmark
- Subscribe
- Mute
- Subscribe to RSS Feed
- Permalink
- Report Inappropriate Content
calculate axis labels based on custom condition
Hi all,
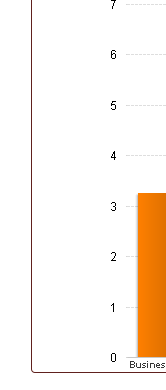
I have a chart which has the Y axis on a scale of 1-6 as shown below. I need to change the labels from the numbers 1-6 based on my condition. For the purpose of this example , lets say I need to say A instead of 1, B instead of 2 and so on..
Is there a way we can achieve this in qlikview? I tried hiding the default labels(changing font color to white), using text in chart and positioning the character A where 1 would have been, but when I resize the graph, I lose the position. Any help will be appreciated.
Thanks
368 Views
1 Reply
Not applicable
2015-07-23
12:15 PM
Author
- Mark as New
- Bookmark
- Subscribe
- Mute
- Subscribe to RSS Feed
- Permalink
- Report Inappropriate Content
Any help guys?
175 Views