Unlock a world of possibilities! Login now and discover the exclusive benefits awaiting you.
- Qlik Community
- :
- All Forums
- :
- QlikView App Dev
- :
- calculating formulas in crosstables
- Subscribe to RSS Feed
- Mark Topic as New
- Mark Topic as Read
- Float this Topic for Current User
- Bookmark
- Subscribe
- Mute
- Printer Friendly Page
- Mark as New
- Bookmark
- Subscribe
- Mute
- Subscribe to RSS Feed
- Permalink
- Report Inappropriate Content
calculating formulas in crosstables
Hi, I'm a bit puzzled on a (for me as beginner) complex situation
I try to explain it with a simple table
Let's say I have a crosstable:
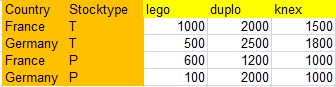
I load it in a crosstable, no problem:
tbl_Stocks:
CrossTable([Product], Data, 2)
LOAD Country,
Stocktype,
FROM
C:\model.xlsm
(ooxml, embedded labels, table is Totals);
I will now explain Stocktype :
T is total stock
P is production stock
now for some graphs i would like to see what amounts are in the market M, by doing M = T - P, per Product
Thanks!
- Tags:
- new_to_qlikview
- Mark as New
- Bookmark
- Subscribe
- Mute
- Subscribe to RSS Feed
- Permalink
- Report Inappropriate Content
Try creating a straight table chart with dimension Product and
=sum({<Stocktype={T}>} Data) - sum({<Stocktype={P}>} Data)
as expression.
This is the set analysis equivalent of
=sum(if(Stocktype='T',Data)) - sum(if(Stocktype='P',Data))
Hope this helps,
Stefan