Unlock a world of possibilities! Login now and discover the exclusive benefits awaiting you.
- Qlik Community
- :
- All Forums
- :
- QlikView App Dev
- :
- categories on dimension axe
- Subscribe to RSS Feed
- Mark Topic as New
- Mark Topic as Read
- Float this Topic for Current User
- Bookmark
- Subscribe
- Mute
- Printer Friendly Page
- Mark as New
- Bookmark
- Subscribe
- Mute
- Subscribe to RSS Feed
- Permalink
- Report Inappropriate Content
categories on dimension axe
Hi,
I’m new at QlikView and use the free version (QVPE – personal edition).
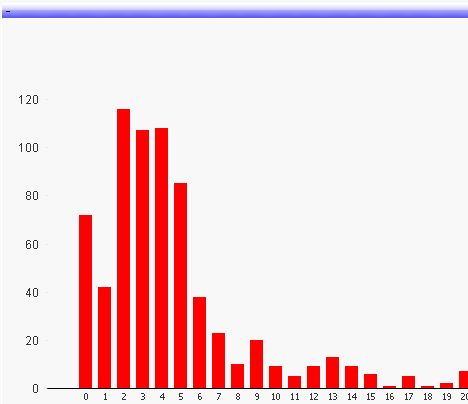
I want to create a diagram like this one (made in excel, see attachment).
My problem is creating the categories on the dimension axe. Every category sums up the values in its ranges. How can I make these in a diagram without making any (complicated) entries in the script?
Thank you for your suggestions!
Regards
Martina
- Mark as New
- Bookmark
- Subscribe
- Mute
- Subscribe to RSS Feed
- Permalink
- Report Inappropriate Content
Hi Martina,
Welcom to Qlikview.
What you should use is a Bar Charts and set the sybtype (Tab Slyle) to Grouped.
That is the way to make a diagram as shown in your example.
If you need to know how to make it exacly please share your excel (are an example ) with us.
Good luck,
Dennis.
- Mark as New
- Bookmark
- Subscribe
- Mute
- Subscribe to RSS Feed
- Permalink
- Report Inappropriate Content
Hi Dennis,
unfortunately I cannot set the style to grouped – this section is grey.
Please see my example in excel; I attach it to this e-mail I hope that works. This excel example looks like my chart in Qlik View.
Thanks and regards
Martina
Gesendet: Montag, 16. Mai 2011 15:50
An: Voigt, Martina__DE
Betreff: - Re: categories on dimension axe
QlikCommunity<http://community.qlik.com/index.jspa>
Re: categories on dimension axe
created by Dennis Hoogenboom<http://community.qlik.com/people/dennisnet> in New to QlikView - View the full discussion<http://community.qlik.com/message/116432#116432
- Mark as New
- Bookmark
- Subscribe
- Mute
- Subscribe to RSS Feed
- Permalink
- Report Inappropriate Content
Hi Martina,
Is this what you are looking for?
See attachment:
Dennis.
- Mark as New
- Bookmark
- Subscribe
- Mute
- Subscribe to RSS Feed
- Permalink
- Report Inappropriate Content
Hi Dennis,
I can’t open the file; I use the free version. Could you post this as a picture or excel?
Martina
Gesendet: Montag, 16. Mai 2011 17:41
An: Voigt, Martina__DE
Betreff: - Re: categories on dimension axe
QlikCommunity<http://community.qlik.com/index.jspa>
Re: categories on dimension axe
created by Dennis Hoogenboom<http://community.qlik.com/people/dennisnet> in New to QlikView - View the full discussion<http://community.qlik.com/message/116466#116466
- Mark as New
- Bookmark
- Subscribe
- Mute
- Subscribe to RSS Feed
- Permalink
- Report Inappropriate Content
Sure.
Is this what you are looking for?
- Mark as New
- Bookmark
- Subscribe
- Mute
- Subscribe to RSS Feed
- Permalink
- Report Inappropriate Content
Hi Dennis,
this is very similar to what I already have I think. What would you do to show the values in categories, e.g. the sum of 0 until 5 on the x-axis as one value? And another value for 6-10 and so on?
Martina
Gesendet: Montag, 16. Mai 2011 18:00
An: Voigt, Martina__DE
Betreff: - Re: categories on dimension axe
QlikCommunity<http://community.qlik.com/index.jspa>
Re: categories on dimension axe
created by Dennis Hoogenboom<http://community.qlik.com/people/dennisnet> in New to QlikView - View the full discussion<http://community.qlik.com/message/116467#116467
- Mark as New
- Bookmark
- Subscribe
- Mute
- Subscribe to RSS Feed
- Permalink
- Report Inappropriate Content
I see what you mean.
What you need is an extra dimension.
The easiest way is to add a colom to your Excel file.
Some thing like GroupID : 0-5, 6-10, 11-15 etc.
Then add this group as a second dimension.
- Mark as New
- Bookmark
- Subscribe
- Mute
- Subscribe to RSS Feed
- Permalink
- Report Inappropriate Content
To build the diagram in Excel is no problem, but I’d like to switch my report (which consists of many of this diagrams and a lot more data) to qlik view to spend less time on it…
I created a file like that to build up some categories:
0-5 <5
6-10 <10
11-14 <15
and so on;
and loaded it via script into Qlik View. Then I added these categories as a second dimension. But Qlik View doesn’t group the values. See:
The problem is I think to get a connection between the values (received through the formula “count”) and the categories!?? How can I tell it that values up to 5 are shown only as category “<5”??
Gesendet: Montag, 16. Mai 2011 18:42
An: Voigt, Martina__DE
Betreff: - Re: categories on dimension axe
QlikCommunity<http://community.qlik.com/index.jspa>
Re: categories on dimension axe
created by Dennis Hoogenboom<http://community.qlik.com/people/dennisnet> in New to QlikView - View the full discussion<http://community.qlik.com/message/116470#116470
- Mark as New
- Bookmark
- Subscribe
- Mute
- Subscribe to RSS Feed
- Permalink
- Report Inappropriate Content
At the moment I get my data for the diagramm with the count formula Count ([name]).
Is it possible and if yes how to get the data like this: count ([name]) if <=5 as one formula and as 2nd formula count ([name]) if >5 and <= 10 and so on ??
Regards
Martina