Unlock a world of possibilities! Login now and discover the exclusive benefits awaiting you.
- Qlik Community
- :
- All Forums
- :
- QlikView App Dev
- :
- changing colours on chart when values below 0 on y...
Options
- Subscribe to RSS Feed
- Mark Topic as New
- Mark Topic as Read
- Float this Topic for Current User
- Bookmark
- Subscribe
- Mute
- Printer Friendly Page
Turn on suggestions
Auto-suggest helps you quickly narrow down your search results by suggesting possible matches as you type.
Showing results for
Not applicable
2015-02-20
10:05 AM
- Mark as New
- Bookmark
- Subscribe
- Mute
- Subscribe to RSS Feed
- Permalink
- Report Inappropriate Content
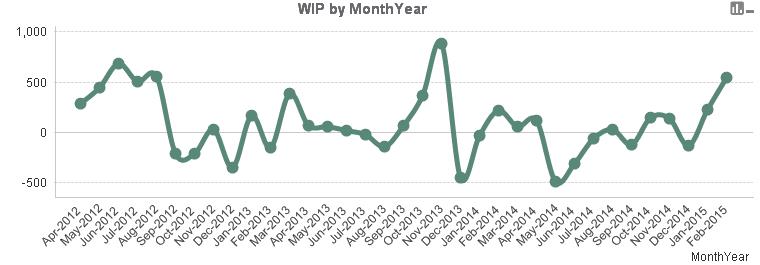
changing colours on chart when values below 0 on y-axis
Hi
is there nice easy way of changing colours on the following line chart when the value drops below 0 on the y-axis, either by changing colour of line or the symbols dots?
I'll also what it applied to the columns in the bar chart when they drop below 0 as this is a Fast Type Change chart!!
if below 0 I want it to change to red etc
392 Views
1 Solution
Accepted Solutions
MVP
2015-02-20
10:14 AM
- Mark as New
- Bookmark
- Subscribe
- Mute
- Subscribe to RSS Feed
- Permalink
- Report Inappropriate Content
Check enclosed file..
316 Views
3 Replies
MVP
2015-02-20
10:14 AM
- Mark as New
- Bookmark
- Subscribe
- Mute
- Subscribe to RSS Feed
- Permalink
- Report Inappropriate Content
Check enclosed file..
317 Views
Partner - Champion
2015-02-20
10:27 AM
- Mark as New
- Bookmark
- Subscribe
- Mute
- Subscribe to RSS Feed
- Permalink
- Report Inappropriate Content
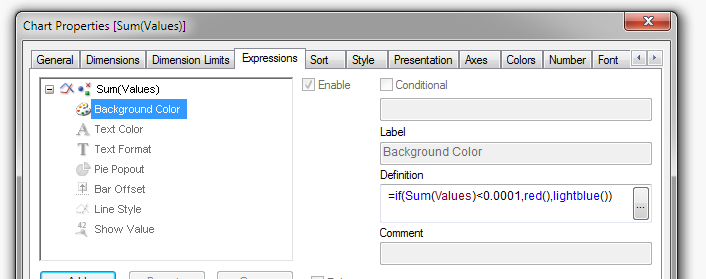
You could try something like this, it actually works better on a bar chart 🙂
316 Views
Partner - Champion
2015-02-20
10:29 AM
- Mark as New
- Bookmark
- Subscribe
- Mute
- Subscribe to RSS Feed
- Permalink
- Report Inappropriate Content
316 Views