Unlock a world of possibilities! Login now and discover the exclusive benefits awaiting you.
- Qlik Community
- :
- All Forums
- :
- QlikView App Dev
- :
- Re: creating charts
- Subscribe to RSS Feed
- Mark Topic as New
- Mark Topic as Read
- Float this Topic for Current User
- Bookmark
- Subscribe
- Mute
- Printer Friendly Page
- Mark as New
- Bookmark
- Subscribe
- Mute
- Subscribe to RSS Feed
- Permalink
- Report Inappropriate Content
creating charts
I have two excel files
in book4 xls file I have three columns 1. Location 2. Office Hours (ET) 3. Application
and in other book5 xls file I have three columns 1. Location 2. # of Users 3. Application
I wrote a script to concatenate these two tables.
Data1:
Load Location,
[Office Hours (ET)],
Application;
Concatenate
Data2:
Load Location,
[# of Users],
Application;
Now I want the following requirement:
- i want to see the “User Location” chart. i want to be able to click on/search a location on the chart and see which applications are associated with that location
- i also want to see office hours by location.
- please help me out.
- Mark as New
- Bookmark
- Subscribe
- Mute
- Subscribe to RSS Feed
- Permalink
- Report Inappropriate Content
DATA: LOAD Location, [# of Users], Application from excel5; Concatanate LOAD Location, Office Hours (ET), Application from excel4; I think it works for u.
- Mark as New
- Bookmark
- Subscribe
- Mute
- Subscribe to RSS Feed
- Permalink
- Report Inappropriate Content
I guess location in the two tables means different things, one for user location and another for office location? If so, application column is used to join the two table, with which, it should be quite straight forward to check application or office hour according to filtered user location.
Could you describe the problem again? Are you trying to plot a map using user location?
- Mark as New
- Bookmark
- Subscribe
- Mute
- Subscribe to RSS Feed
- Permalink
- Report Inappropriate Content
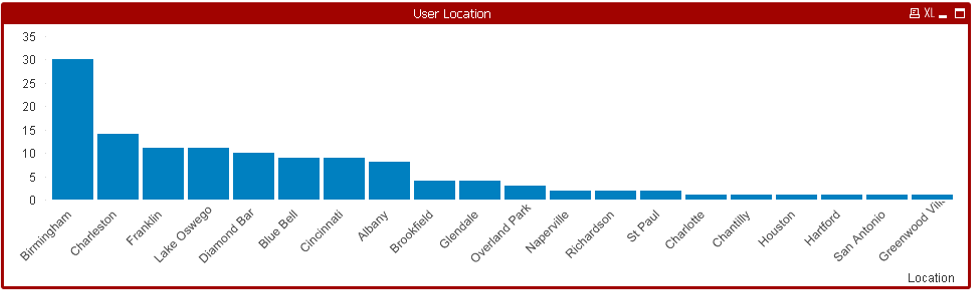
yes I need to plot a graph according to location, I have a list box application, when I click on application I have to see the number of users using that application with respect to location.
Below is the graph I need to plot the same.
and no idea how to show office hours according to location.
- Mark as New
- Bookmark
- Subscribe
- Mute
- Subscribe to RSS Feed
- Permalink
- Report Inappropriate Content
What is expression for it ?
- Mark as New
- Bookmark
- Subscribe
- Mute
- Subscribe to RSS Feed
- Permalink
- Report Inappropriate Content
Since multiple office locations are linked to simple application, multiple office hour are expected. In that case, do you wanna show a list? ..