Unlock a world of possibilities! Login now and discover the exclusive benefits awaiting you.
- Qlik Community
- :
- All Forums
- :
- QlikView App Dev
- :
- data not seen in charts
- Subscribe to RSS Feed
- Mark Topic as New
- Mark Topic as Read
- Float this Topic for Current User
- Bookmark
- Subscribe
- Mute
- Printer Friendly Page
- Mark as New
- Bookmark
- Subscribe
- Mute
- Subscribe to RSS Feed
- Permalink
- Report Inappropriate Content
data not seen in charts
HiI
I want to depict a sales summary in form of a chart and my business operates on basis of seasons like 17A (means 17 istands for year and A stands for winter season)
I want to compare between two seasons (attachment given) but I am not able to load my data
what may be the reason behind the same?
- Mark as New
- Bookmark
- Subscribe
- Mute
- Subscribe to RSS Feed
- Permalink
- Report Inappropriate Content
hi
please describe your issue properly so that the community member can understand your requirement.
- Mark as New
- Bookmark
- Subscribe
- Mute
- Subscribe to RSS Feed
- Permalink
- Report Inappropriate Content
It would be wise if you could share the app (scramble the data if you want).
I think there might be problem with associations. as a result the data is not visible when specific field values are selected.
- Mark as New
- Bookmark
- Subscribe
- Mute
- Subscribe to RSS Feed
- Permalink
- Report Inappropriate Content
Hi
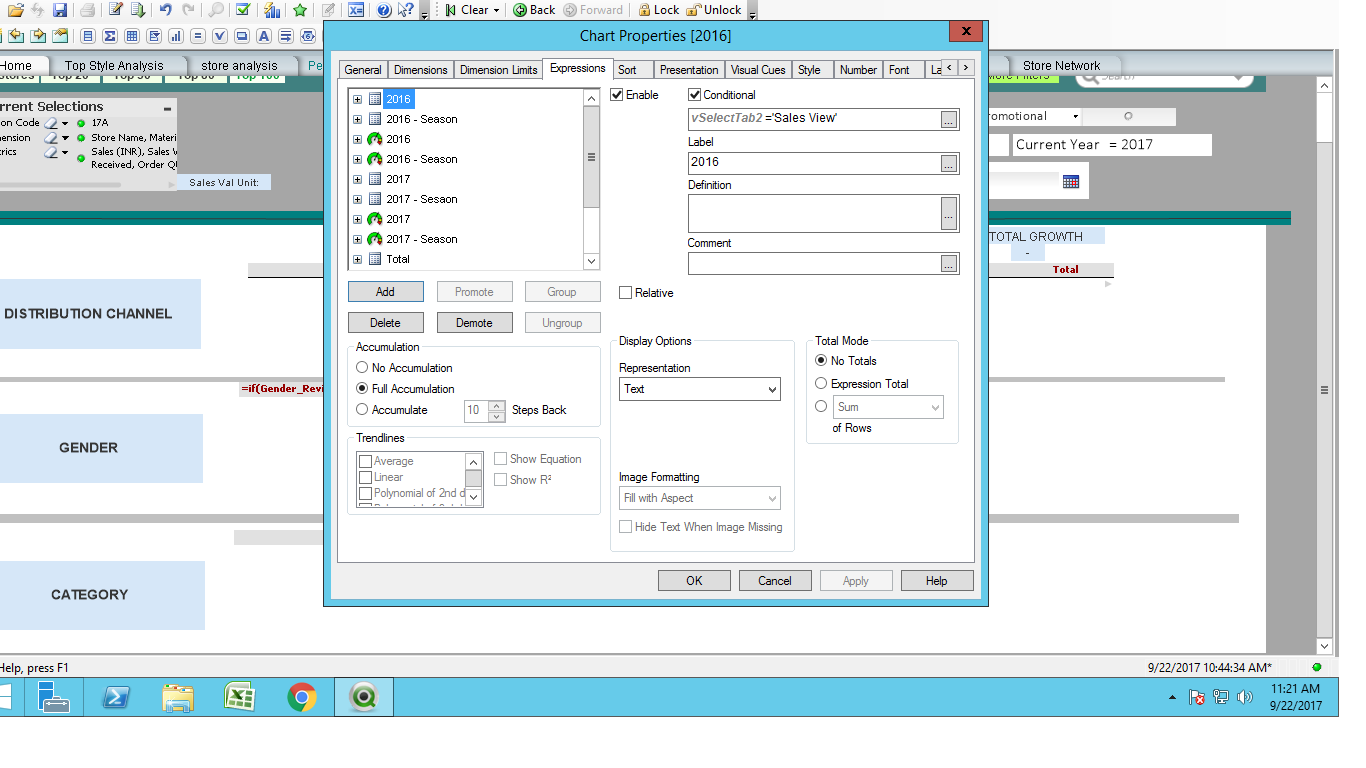
i want to show sales summary of year 2016 and 2017 ie I want to compare sales between two seasons . i want to write expression for the same in charts. my dimensions will be gender, distribution channel and category
please tell me how to depict the data in form of charts ?
- Mark as New
- Bookmark
- Subscribe
- Mute
- Subscribe to RSS Feed
- Permalink
- Report Inappropriate Content
sum({<year=2016>}sales) ->sale for 2016
sum({<year=2017>}sales) -> sale for 2017
use {$) or {1} depending upon if you want other selection to make impact or not.
without seeing a sample or data how its used it's hard to predict .
if you want to select current and previous season by list box use alternate states. and use in the set expression
regards
Pradosh
- Mark as New
- Bookmark
- Subscribe
- Mute
- Subscribe to RSS Feed
- Permalink
- Report Inappropriate Content
These two expressions give you Sales amount for max available year and the previous year
sum({< YearField={$(=max(YearField))} >}[SalesAmount])
and
sum({< YearField={$(=max(YearField)-1)} >}[SalesAmount])
These two expressions give you Sales amount for current year and the previous year
sum({< YearField={$(=Year(Today()))} >}[SalesAmount])
and
sum({< YearField={$(=Year(Today())-1)} >}[SalesAmount])
- Mark as New
- Bookmark
- Subscribe
- Mute
- Subscribe to RSS Feed
- Permalink
- Report Inappropriate Content
Hi
I want some suggestion regarding how to depict the sale summary on basis of different seasons like 17A, 17P...
and year like 2017
which chart will be suitable for the same to depict the sale and please also suggest a corresonding expression?
- Mark as New
- Bookmark
- Subscribe
- Mute
- Subscribe to RSS Feed
- Permalink
- Report Inappropriate Content
As sudeep has also mentioned if you can share a sample app it will be easy for us to understand what do you mean by 17A,17P . if possible share the app.
- Mark as New
- Bookmark
- Subscribe
- Mute
- Subscribe to RSS Feed
- Permalink
- Report Inappropriate Content
- Mark as New
- Bookmark
- Subscribe
- Mute
- Subscribe to RSS Feed
- Permalink
- Report Inappropriate Content
for 2016
=num(
sum(if(Sold_Date <= MakeDate(Prev_Year,month(To),day(To)) and Sold_Date >= MakeDate(Prev_Year,month(From),day(From)), [inv value]))/Sales_INR_Unit,
'#,##0.0')
I am using following expression on chart for 2016
please suggest why the data is not seen in charts?