Unlock a world of possibilities! Login now and discover the exclusive benefits awaiting you.
- Qlik Community
- :
- All Forums
- :
- QlikView App Dev
- :
- gauge chart segment
- Subscribe to RSS Feed
- Mark Topic as New
- Mark Topic as Read
- Float this Topic for Current User
- Bookmark
- Subscribe
- Mute
- Printer Friendly Page
- Mark as New
- Bookmark
- Subscribe
- Mute
- Subscribe to RSS Feed
- Permalink
- Report Inappropriate Content
gauge chart segment
Hi everybody,
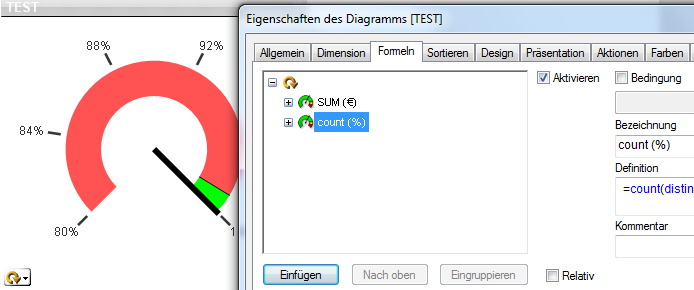
I do have a problem with my gauge chart. The goal of my chart is, to switch between two formulas with changed segments.
I have one dimensions and two formulas which I grouped. The first formula shows percentages the second shows amounts thats why I need different segments. Does anyone has an idea how to solve my problem?
Thanks in advance 
- Tags:
- new_to_qlikview
- Mark as New
- Bookmark
- Subscribe
- Mute
- Subscribe to RSS Feed
- Permalink
- Report Inappropriate Content
Use two gauge charts each with one expression and show/hide them as needed based on which metric is selected by the user.
talk is cheap, supply exceeds demand
- Mark as New
- Bookmark
- Subscribe
- Mute
- Subscribe to RSS Feed
- Permalink
- Report Inappropriate Content
I cannot visualize what you describe. And, no dimensions needed in a gauge chart. Could you please upload an example and give a better description? With a picture maybe?
- Mark as New
- Bookmark
- Subscribe
- Mute
- Subscribe to RSS Feed
- Permalink
- Report Inappropriate Content
Hi Gysbert, thanks for you quick reply. But I try to avoid to use two charts.
- Mark as New
- Bookmark
- Subscribe
- Mute
- Subscribe to RSS Feed
- Permalink
- Report Inappropriate Content
oh I'm sorry, that was my mistake. I don't have dimensions.
- Mark as New
- Bookmark
- Subscribe
- Mute
- Subscribe to RSS Feed
- Permalink
- Report Inappropriate Content
Good luck then. I think you'll need it. I hope you can stand the mess 
talk is cheap, supply exceeds demand