Unlock a world of possibilities! Login now and discover the exclusive benefits awaiting you.
- Qlik Community
- :
- All Forums
- :
- QlikView App Dev
- :
- grouped and stacked bar charts issues
- Subscribe to RSS Feed
- Mark Topic as New
- Mark Topic as Read
- Float this Topic for Current User
- Bookmark
- Subscribe
- Mute
- Printer Friendly Page
- Mark as New
- Bookmark
- Subscribe
- Mute
- Subscribe to RSS Feed
- Permalink
- Report Inappropriate Content
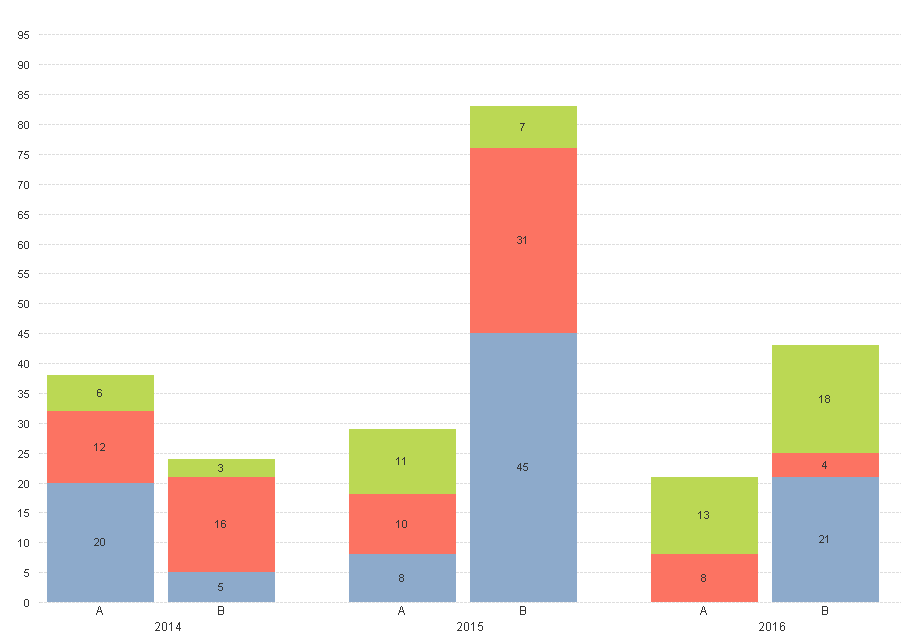
grouped and stacked bar charts issues
| year | category | Peter | Paul | Tobias |
|---|---|---|---|---|
| 2014 | A | 20 | 12 | 6 |
| 2014 | B | 5 | 16 | 3 |
| 2015 | A | 8 | 10 | 11 |
| 2015 | B | 45 | 31 | 7 |
2016 | A | 0 | 8 | 13 |
| 2016 | B | 21 | 4 | 18 |
LOAD year,
category,
Peter,
Paul,
Tobias,
year &'-'& category as combination
FROM
sample_data.xlsx
(ooxml, embedded labels, table is Tabble1);
- Mark as New
- Bookmark
- Subscribe
- Mute
- Subscribe to RSS Feed
- Permalink
- Report Inappropriate Content
You can't if you want to use two dimensions for the x-axis. You can try using a calculated dimension that concatenates the Year and Category dimensions: = Year & ' - ' & Category.
talk is cheap, supply exceeds demand
- Mark as New
- Bookmark
- Subscribe
- Mute
- Subscribe to RSS Feed
- Permalink
- Report Inappropriate Content
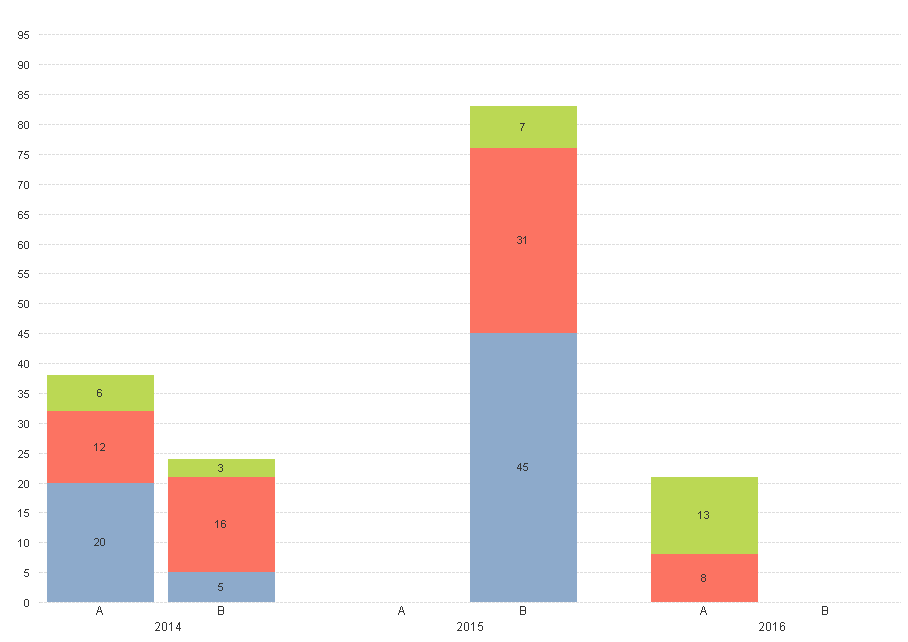
Thanks for your reply, but if I do what you suggested I lose the "grouped" feature ... and I definetly need to display as groups. Isn't there any other possibility? I am also in the situation that I can change the structure of my data source, so the most important is that I can realize the shown bar format. Any ideas someone?
- Mark as New
- Bookmark
- Subscribe
- Mute
- Subscribe to RSS Feed
- Permalink
- Report Inappropriate Content
HI,
You can simply go to chart properties and under the dimension tab just select the check box displaying 'Suppress when value is null '
Hope it works
- Mark as New
- Bookmark
- Subscribe
- Mute
- Subscribe to RSS Feed
- Permalink
- Report Inappropriate Content
that was the first thing I tried, but unfortunately it doesn't work 
- Mark as New
- Bookmark
- Subscribe
- Mute
- Subscribe to RSS Feed
- Permalink
- Report Inappropriate Content
Does really no one see a solution for my problem? I am still struggeling with that. And again I am 100% flexible with the table structure!!! I just need to realise the diagram results.
Thanks for reply!
- Mark as New
- Bookmark
- Subscribe
- Mute
- Subscribe to RSS Feed
- Permalink
- Report Inappropriate Content
You want the grouped feature, but you don't want it to act like the grouped feature. Well, that's simply not possible. If you use two dimensions on the same axis then space is reserved for each dimension value (A and B in your example) even if no data is available.
talk is cheap, supply exceeds demand