Unlock a world of possibilities! Login now and discover the exclusive benefits awaiting you.
- Qlik Community
- :
- All Forums
- :
- QlikView App Dev
- :
- Re: help with chart please - newbie
- Subscribe to RSS Feed
- Mark Topic as New
- Mark Topic as Read
- Float this Topic for Current User
- Bookmark
- Subscribe
- Mute
- Printer Friendly Page
- Mark as New
- Bookmark
- Subscribe
- Mute
- Subscribe to RSS Feed
- Permalink
- Report Inappropriate Content
help with chart please - newbie
hello everyone
have the following fields: these are months from an excel spreadsheet
I am trying to compile a bar chart to show the fluctuation of attendances per month. i think i should be containing these fields into something else like month but i am unsure on how to do this
any guidance would be greatly appreciated
thanks
D
- Tags:
- new_to_qlikview
- Mark as New
- Bookmark
- Subscribe
- Mute
- Subscribe to RSS Feed
- Permalink
- Report Inappropriate Content
Hi,
Let Date be your datefield..and Attendence is field with 0 for Absence or 1 for presence
Now while loading..........
Load
Date,
Attendence,
--------new aliase field-----------------
Month(Date) as Month
from...exl....
Now you can use month as Dimension...and Expression=sum(Attendence)
Any other issue let me know.
- Mark as New
- Bookmark
- Subscribe
- Mute
- Subscribe to RSS Feed
- Permalink
- Report Inappropriate Content
Hello
Many Thanks
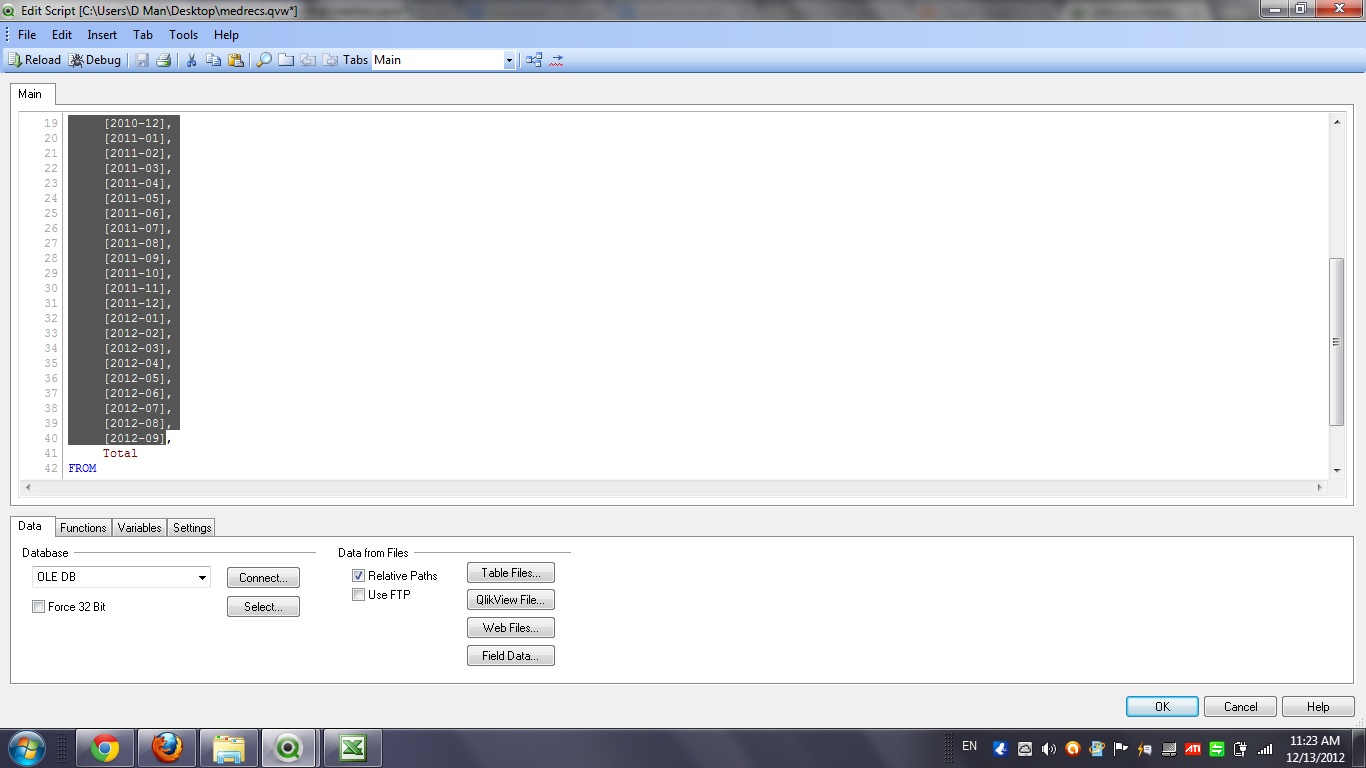
I would have done as you have mentioned but the data i am using has the following layout (i have removed the figures)

I am thinking the script needs to be changed to categorise all the dates into one field but i am unsure about the correct way to do this?
Thanks
D
- Mark as New
- Bookmark
- Subscribe
- Mute
- Subscribe to RSS Feed
- Permalink
- Report Inappropriate Content
Load the script using the wizard (when you click on the table files button at the bottom of the edit script box it prompts you to open a file and then opens a wizard) go through the process and choose the enable transformation process option. When you get to the File Wizard option view it gives you the option to put your data into a Crosstable - this will help you to put all the dates into one data field.
Hope this helps 