Unlock a world of possibilities! Login now and discover the exclusive benefits awaiting you.
- Qlik Community
- :
- All Forums
- :
- QlikView App Dev
- :
- how to add two values in a field when it is using ...
- Subscribe to RSS Feed
- Mark Topic as New
- Mark Topic as Read
- Float this Topic for Current User
- Bookmark
- Subscribe
- Mute
- Printer Friendly Page
- Mark as New
- Bookmark
- Subscribe
- Mute
- Subscribe to RSS Feed
- Permalink
- Report Inappropriate Content
how to add two values in a field when it is using dimension in a chart
Hi all,
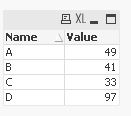
I have a field "Name" as below.
Name
A
B
C
D
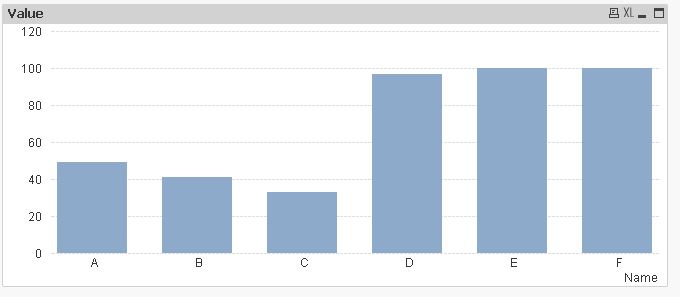
i need two extra values in the above field when it is using in chart.
Answer:
Name
A
B
C
D
E
F
how it is possible?
- « Previous Replies
-
- 1
- 2
- Next Replies »
Accepted Solutions
- Mark as New
- Bookmark
- Subscribe
- Mute
- Subscribe to RSS Feed
- Permalink
- Report Inappropriate Content
Hi,
you could trick a chart into showing additional values with the already suggested ValueList() function using only the field name of your loaded data like this:
LOAD *,
     Ceil(Rand()*100) as Value
INLINE [
    Name
    A
    B
    C
    D
];
Downside is, you can't select in this chart.
Can you share an application to show what you're trying to present as expression values for the additional dimension values? Maybe there is another way to do so?
hope this helps
regards
Marco
- Mark as New
- Bookmark
- Subscribe
- Mute
- Subscribe to RSS Feed
- Permalink
- Report Inappropriate Content
You can load those in script from inline tables like as below and use other columns similar to your existing table
'E' as Name
'F' as Name
- Mark as New
- Bookmark
- Subscribe
- Mute
- Subscribe to RSS Feed
- Permalink
- Report Inappropriate Content
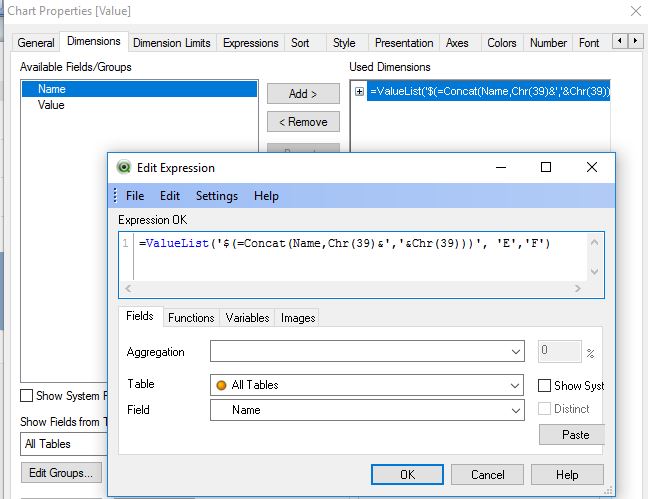
You can try as below as dimension:
=ValueList('A','B','C','D','E','F')
- Mark as New
- Bookmark
- Subscribe
- Mute
- Subscribe to RSS Feed
- Permalink
- Report Inappropriate Content
Hi subhasmita,
i need in front end for one table only. can i do?
- Mark as New
- Bookmark
- Subscribe
- Mute
- Subscribe to RSS Feed
- Permalink
- Report Inappropriate Content
Hi thirumala,
I need a vlues with a field from datasource, that filed not fully in valuelist.
- Mark as New
- Bookmark
- Subscribe
- Mute
- Subscribe to RSS Feed
- Permalink
- Report Inappropriate Content
Can you upload a sample file for your scenario?
- Mark as New
- Bookmark
- Subscribe
- Mute
- Subscribe to RSS Feed
- Permalink
- Report Inappropriate Content
Hi,
you could trick a chart into showing additional values with the already suggested ValueList() function using only the field name of your loaded data like this:
LOAD *,
     Ceil(Rand()*100) as Value
INLINE [
    Name
    A
    B
    C
    D
];
Downside is, you can't select in this chart.
Can you share an application to show what you're trying to present as expression values for the additional dimension values? Maybe there is another way to do so?
hope this helps
regards
Marco
- Mark as New
- Bookmark
- Subscribe
- Mute
- Subscribe to RSS Feed
- Permalink
- Report Inappropriate Content
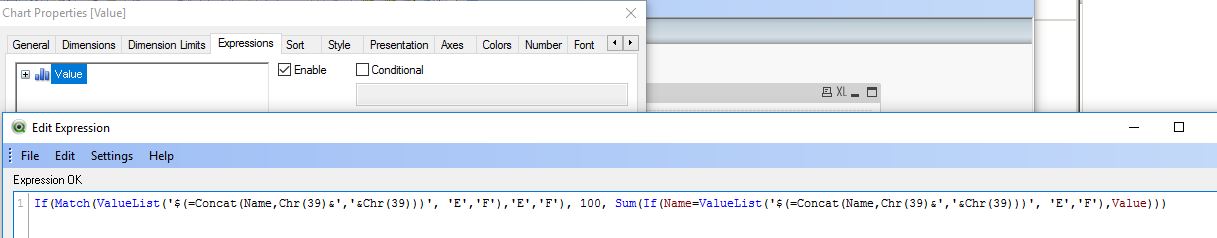
Can you explain why it must be in the chart and not in script? I might handle this sort of case by adding a new table with a field that has the more complete list, and connecting it to the other field when the values match. Something like this:
MoreNames:
LOAD *,Name as MoreName;
LOAD text(fieldvalue('Name',recno())) as Name
AUTOGENERATE fieldvaluecount('Name')
;
CONCATENATE (MoreNames)
LOAD subfield('E,F',',') as MoreName
AUTOGENERATE 1
;
And then do the chart like this:
Dimension = MoreName
Expression = alt(Value,100)
Borrowed Marco's QVW and added to it. See attached. There are differences in behavior even if they appear the same on the surface. You CAN select in the chart, but it may not behave exactly as someone expects, since it isn't selecting the Name. And if you do select a Name, E and F disappear from my chart, but not from Marco's.
- Mark as New
- Bookmark
- Subscribe
- Mute
- Subscribe to RSS Feed
- Permalink
- Report Inappropriate Content
Try this:
LOAD * INLINE [
Name, value
A, 11
B, 22
C, 33
D, 44
];
load * Inline [
kpi
1
2
3
];

Presentation tab----uncheck suppress Zero-Values.
- Mark as New
- Bookmark
- Subscribe
- Mute
- Subscribe to RSS Feed
- Permalink
- Report Inappropriate Content
Hi macro,
thank you so much.
- « Previous Replies
-
- 1
- 2
- Next Replies »