Unlock a world of possibilities! Login now and discover the exclusive benefits awaiting you.
- Qlik Community
- :
- All Forums
- :
- QlikView App Dev
- :
- how to combine two dimension value into one column...
- Subscribe to RSS Feed
- Mark Topic as New
- Mark Topic as Read
- Float this Topic for Current User
- Bookmark
- Subscribe
- Mute
- Printer Friendly Page
- Mark as New
- Bookmark
- Subscribe
- Mute
- Subscribe to RSS Feed
- Permalink
- Report Inappropriate Content
how to combine two dimension value into one column?
Hi All,
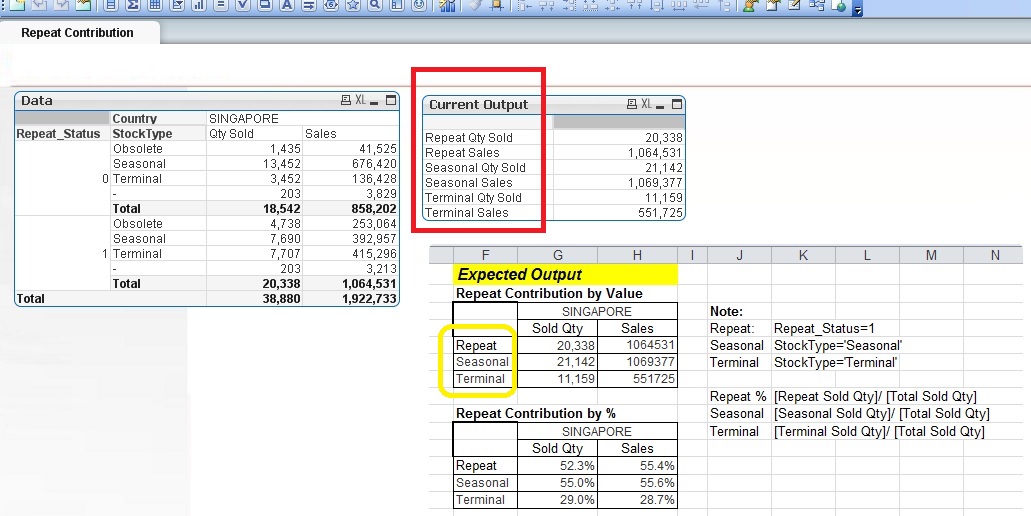
Please refer to the attachment, I'm trying to calculate repeat Contribution using Stock Type and Repeated Status wise.
Issue: how to achieve below screen shot expected output format (need to combine two dimension (Repeat_Status & Stock_Type) into one dimensional value.
What i've tried, tried to created pivot table calculated measure (refer current output).but expected format not coming? will qlikview will support below expected output format ? kindly advise. Thanks
Thanks,
Deva
Accepted Solutions
- Mark as New
- Bookmark
- Subscribe
- Mute
- Subscribe to RSS Feed
- Permalink
- Report Inappropriate Content
Hi Deva,
Please see screenshot below and qvw attached. Any good?
Warm regards,
Nish
- Mark as New
- Bookmark
- Subscribe
- Mute
- Subscribe to RSS Feed
- Permalink
- Report Inappropriate Content
Hi Deva,
Please see screenshot below and qvw attached. Any good?
Warm regards,
Nish
- Mark as New
- Bookmark
- Subscribe
- Mute
- Subscribe to RSS Feed
- Permalink
- Report Inappropriate Content
Many Thanks 
- Mark as New
- Bookmark
- Subscribe
- Mute
- Subscribe to RSS Feed
- Permalink
- Report Inappropriate Content
Thank you!
- Mark as New
- Bookmark
- Subscribe
- Mute
- Subscribe to RSS Feed
- Permalink
- Report Inappropriate Content
how to apply below Calculated measure as Repeat Status
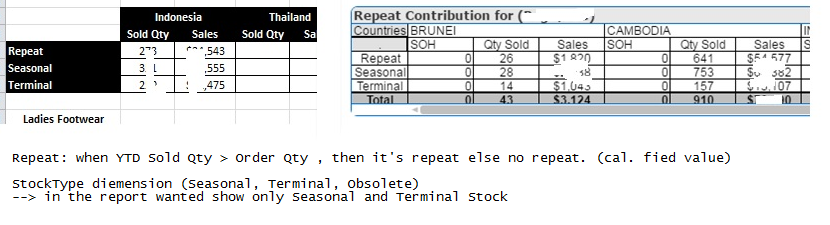
Finding repeat Status flag rule:
=aggr(if(sum({<Year=,Week=,StoreName=>}SoldQty) > sum({<Year={'*'},Week={"*"},Type_ID={'NB'},StoreName=>} OrderQty), 'Repeat','No Repeat'),ArticleNo,Countries)
how to change below conditional statement using above expression.
=If(pick(match($Field,'StockType','Repeat_Status'),StockType,Repeat_Status)=1,'Repeat',
If(match(pick(match($Field,'StockType','Repeat_Status'),StockType,Repeat_Status),0,'Obsolete'),null(),
(pick(match($Field,'StockType','Repeat_Status'),StockType,Repeat_Status))))
Thanks,
Deva
- Mark as New
- Bookmark
- Subscribe
- Mute
- Subscribe to RSS Feed
- Permalink
- Report Inappropriate Content
Not sure I follow your question... would you be able to elaborate a little?
- Mark as New
- Bookmark
- Subscribe
- Mute
- Subscribe to RSS Feed
- Permalink
- Report Inappropriate Content
- Mark as New
- Bookmark
- Subscribe
- Mute
- Subscribe to RSS Feed
- Permalink
- Report Inappropriate Content
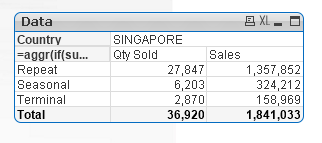
Based on the sample you have above, what is the output are you expecting to see?
Something like this?
- Mark as New
- Bookmark
- Subscribe
- Mute
- Subscribe to RSS Feed
- Permalink
- Report Inappropriate Content
Hi Sunny,
Can you share the expression. for the figure i have check it out again. Thanks.
Thanks
- Mark as New
- Bookmark
- Subscribe
- Mute
- Subscribe to RSS Feed
- Permalink
- Report Inappropriate Content
That is the thing I have not changed anything... I used what you gave.... attaching the qvw