Unlock a world of possibilities! Login now and discover the exclusive benefits awaiting you.
- Qlik Community
- :
- All Forums
- :
- QlikView App Dev
- :
- how to create a trend chart of KPI floating with a...
- Subscribe to RSS Feed
- Mark Topic as New
- Mark Topic as Read
- Float this Topic for Current User
- Bookmark
- Subscribe
- Mute
- Printer Friendly Page
- Mark as New
- Bookmark
- Subscribe
- Mute
- Subscribe to RSS Feed
- Permalink
- Report Inappropriate Content
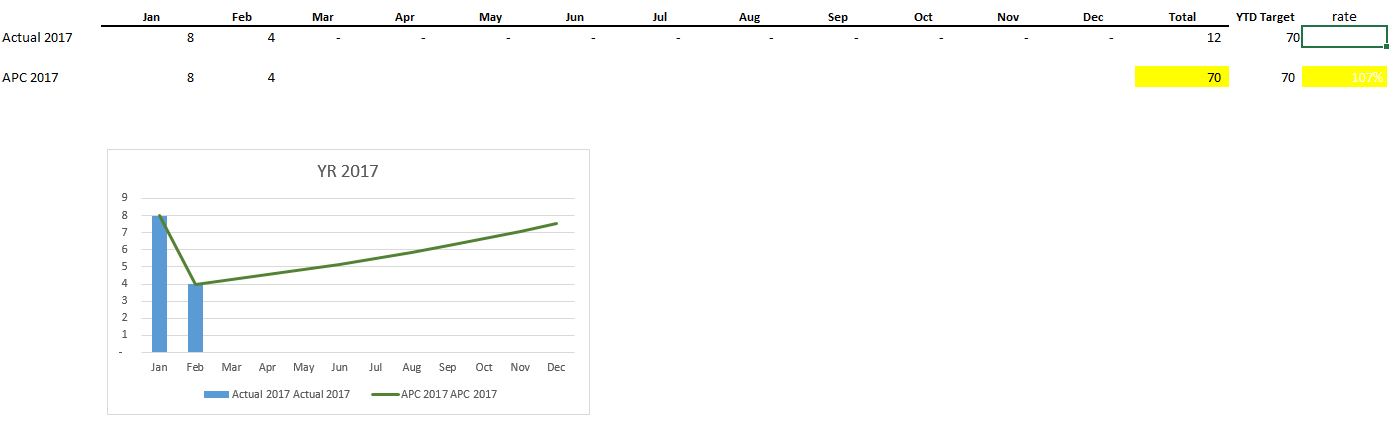
how to create a trend chart of KPI floating with actual YTD number
Hi Guys,
I am new to Qlikview, and would like to create a trend chart basing on the past actual number and Yearly target in Qlikview. The result should be similar to the chart as attachment. Anyone have any idea on this? Many thanks.
- Mark as New
- Bookmark
- Subscribe
- Mute
- Subscribe to RSS Feed
- Permalink
- Report Inappropriate Content
Hi Jason
As variant< may be as in attached file
Regards,
Andrey
- Mark as New
- Bookmark
- Subscribe
- Mute
- Subscribe to RSS Feed
- Permalink
- Report Inappropriate Content
Hi Andrey,
Thanks for your response. I saw you adding the APC2017 data to achieve the graph, could we achieve by writing the expression since my file data was already complicated and we don't wan to keep maintaining this. I was thinking the logic for expression could be "(70-sum(YTD))/ Remaining months" or using what if analysis. Please give me more advice.
Many thanks.
Best regards,
Jason Liu