Unlock a world of possibilities! Login now and discover the exclusive benefits awaiting you.
- Qlik Community
- :
- All Forums
- :
- QlikView App Dev
- :
- how to put the expression label vertically along t...
- Subscribe to RSS Feed
- Mark Topic as New
- Mark Topic as Read
- Float this Topic for Current User
- Bookmark
- Subscribe
- Mute
- Printer Friendly Page
- Mark as New
- Bookmark
- Subscribe
- Mute
- Subscribe to RSS Feed
- Permalink
- Report Inappropriate Content
how to put the expression label vertically along the Y axis in bar chart?
Dear All,
I have created very simple bar chart in QV like shown below:
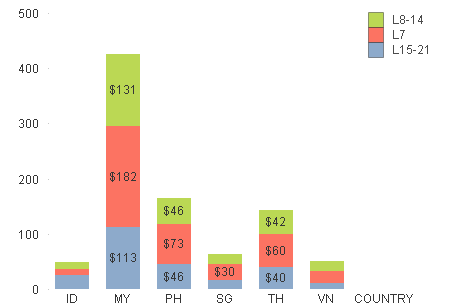
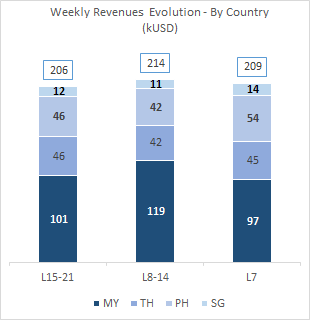
But I want to show the bar chart like shown below:
I would be really grateful if anyone advise me that how to archive my requirement.
I have attached the qvw file and source file for your reference.
Regards,
Robert
- Tags:
- new_to_qlikview
- Mark as New
- Bookmark
- Subscribe
- Mute
- Subscribe to RSS Feed
- Permalink
- Report Inappropriate Content
Hi,
Create an another expression having some of all segments..
Then in expression tab uncheck the bar option and enable values on data points.
HTH
Sushil
- Mark as New
- Bookmark
- Subscribe
- Mute
- Subscribe to RSS Feed
- Permalink
- Report Inappropriate Content
Hi,
Sorry, I didn't understand. could you please do it in attached my QVW file.
Regards,
Robert
- Mark as New
- Bookmark
- Subscribe
- Mute
- Subscribe to RSS Feed
- Permalink
- Report Inappropriate Content
hi have a look at the attach example
i changed the table in the load script by using
cross table function
then it's straight forward graph