Unlock a world of possibilities! Login now and discover the exclusive benefits awaiting you.
- Qlik Community
- :
- All Forums
- :
- QlikView App Dev
- :
- need help
- Subscribe to RSS Feed
- Mark Topic as New
- Mark Topic as Read
- Float this Topic for Current User
- Bookmark
- Subscribe
- Mute
- Printer Friendly Page
- Mark as New
- Bookmark
- Subscribe
- Mute
- Subscribe to RSS Feed
- Permalink
- Report Inappropriate Content
need help
Hi Folks,
Please help me on this scenario.
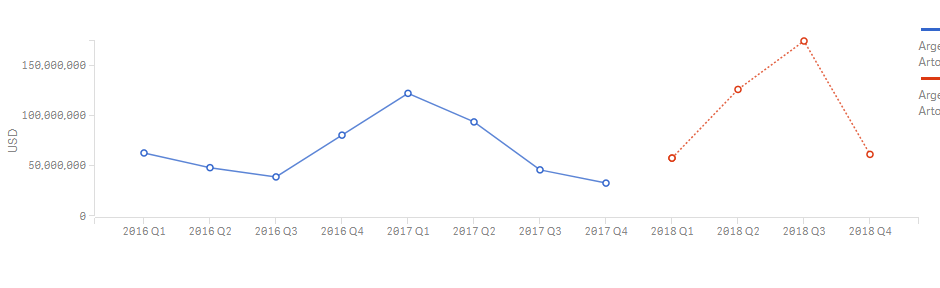
I have craeted line chart with
Dim1: YearQuarter
Dim2: Valuelist('Actual_'&Brand, 'forecast_'&Brand)
Expression: Pick(Match(
Valuelist('Actual_'&Brand, 'forecast_'&Brand),'Actual_'&Brand, 'forecast_'&Brand),
Sum(Actual), Sum(Forecast)
)
Now the chart is coming fine as I expected.
Here Actual line is starting from 2016Q1 to 2017Q4
and Forecast line is starting from 2018Q1 to 2018 Q4
But here I'd like to see my output as below
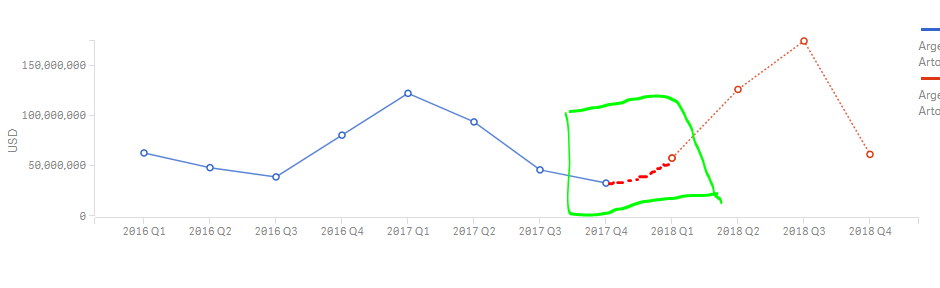
In this chart,
I need to write If condition for Forecast line (Forecast line should start from end of the Actual line period).
Hope, this clear.I can't share complete data as am working in actual application.
How do we accomplish this requirement.
Any suggestions will be appreciated.
Thanks.
- Mark as New
- Bookmark
- Subscribe
- Mute
- Subscribe to RSS Feed
- Permalink
- Report Inappropriate Content
hello
for me, as there are two measures, on can't join the two lines
if you want only one, you have to create a time axis and a measure but in this case, your line will have one colour only
- Mark as New
- Bookmark
- Subscribe
- Mute
- Subscribe to RSS Feed
- Permalink
- Report Inappropriate Content
Any other approaches to accomplish this???
- Mark as New
- Bookmark
- Subscribe
- Mute
- Subscribe to RSS Feed
- Permalink
- Report Inappropriate Content
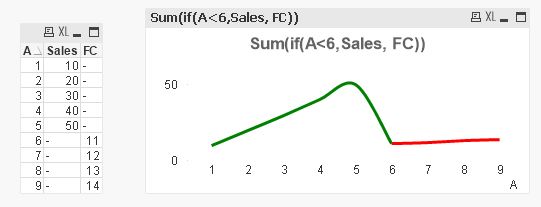
Instead of two separate expressions, try to do it in single expression like below
- Mark as New
- Bookmark
- Subscribe
- Mute
- Subscribe to RSS Feed
- Permalink
- Report Inappropriate Content
Hi Tresesco,
Thanks for quick response.
Can we accomplish this requirement with
Pick(Match(
Valuelist('Actual_'&Brand, 'forecast_'&Brand),'Actual_'&Brand, 'forecast_'&Brand),
Sum(Actual), Sum(Forecast)
)

All two lines which I mentioned(Actual and Forecast) are saparate lines only.
But I need to write the condition for Forecast line to start from
2017 Q4 by default value(2017 Q4 Actual value).
Is this possible??