Unlock a world of possibilities! Login now and discover the exclusive benefits awaiting you.
- Qlik Community
- :
- All Forums
- :
- QlikView App Dev
- :
- negative and positive values
- Subscribe to RSS Feed
- Mark Topic as New
- Mark Topic as Read
- Float this Topic for Current User
- Bookmark
- Subscribe
- Mute
- Printer Friendly Page
- Mark as New
- Bookmark
- Subscribe
- Mute
- Subscribe to RSS Feed
- Permalink
- Report Inappropriate Content
negative and positive values
how Gauge chart deals with -ve values and +ve values both at a time within %'s.
I have minimum as -100% and maximum value as 200%.
So i wil put -1 as min and max as 2. Now i want to set lower bound something , So that i will get red(<75%),yellow(>75 and <95), and green(>95).
Not able to set lower bounds with -ve value percentages. If possible can somebody help me out in giving any sample file illustrating the example with gauge settings
I am looking to do in the attached file..
Note : Am using personal desktop edition so please share any calculations don't share QVW files why because i can't open those..
- Mark as New
- Bookmark
- Subscribe
- Mute
- Subscribe to RSS Feed
- Permalink
- Report Inappropriate Content
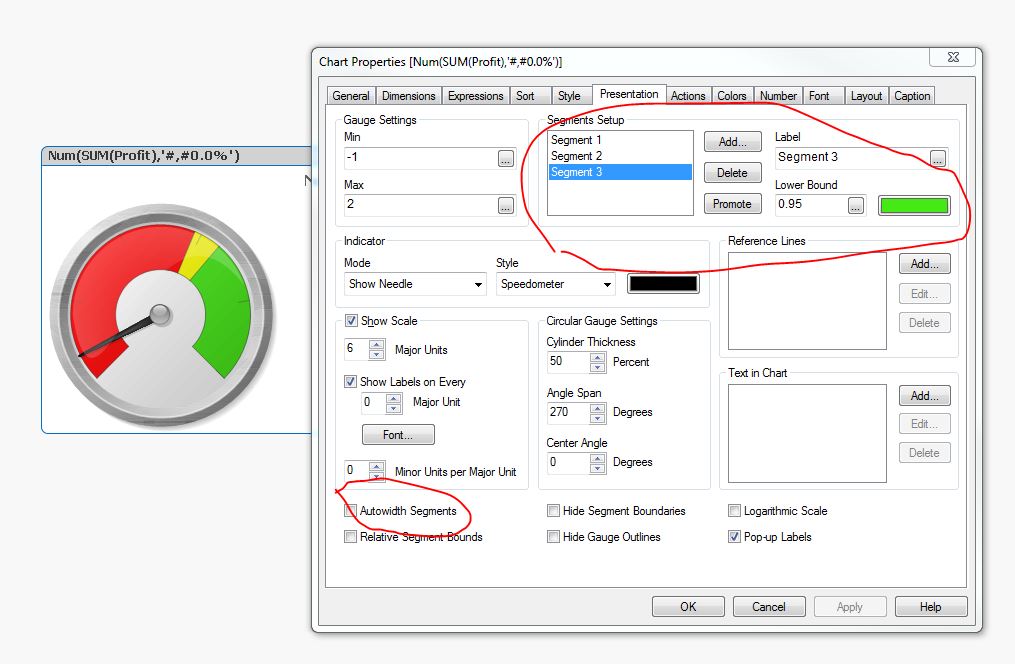
Go to Presentation Tab
Untick Autowidth Segments
Go to Segments Setup
Add Three Segments
For Segment 1
Lower Bound
-1
Color Red
For Segment 2
Lower Bound
0.75
Color Yellow
For Segment 3
Lower Bound
0.95
Color Green
- Mark as New
- Bookmark
- Subscribe
- Mute
- Subscribe to RSS Feed
- Permalink
- Report Inappropriate Content
Hi Manish,
Thanks ,here i have to display like if we have sales>50 then red or else blue like this....
- Mark as New
- Bookmark
- Subscribe
- Mute
- Subscribe to RSS Feed
- Permalink
- Report Inappropriate Content
You are saying you have expression ranges -100% to 200%
Share your application here along with requirements.. will check and come back to you.