Unlock a world of possibilities! Login now and discover the exclusive benefits awaiting you.
- Qlik Community
- :
- All Forums
- :
- QlikView App Dev
- :
- not working as expected
- Subscribe to RSS Feed
- Mark Topic as New
- Mark Topic as Read
- Float this Topic for Current User
- Bookmark
- Subscribe
- Mute
- Printer Friendly Page
- Mark as New
- Bookmark
- Subscribe
- Mute
- Subscribe to RSS Feed
- Permalink
- Report Inappropriate Content
not working as expected
Hi All,
i have two charts and two listboxes here the issue with alternate state
dimension1 and dimension2
chart1 and chart2
so am using state1 for dimenson 1 and chart1
state2 for diemsion2 and chart2
issue: when i select in chart2 chart 1 also reflecting
what might be the issue?
used xpression for chart1: =sum({<[Type]= ,Dimension2= ,Measure2= >}[Amount])/$(vFormat)
used xpression for chart2: =sum({<[Type]= ,Dimension1= ,Measure1= >}[Amount])/$(vFormat)
variable: vFormat=FormatId
format id is field and having values 1000,10000
thanks
Sony
- « Previous Replies
- Next Replies »
Accepted Solutions
- Mark as New
- Bookmark
- Subscribe
- Mute
- Subscribe to RSS Feed
- Permalink
- Report Inappropriate Content
Check the attachment. You need to set the state to all objects (list boxes and charts here) in the same group.
- Mark as New
- Bookmark
- Subscribe
- Mute
- Subscribe to RSS Feed
- Permalink
- Report Inappropriate Content
any idea Ali Ahmad
- Mark as New
- Bookmark
- Subscribe
- Mute
- Subscribe to RSS Feed
- Permalink
- Report Inappropriate Content
Hi,
when you select in a chart it seems not to act as in a listbox,
so <field=> doesn't work,
add 1 before :
{1<type=, .....}
it will work
regards
- Mark as New
- Bookmark
- Subscribe
- Mute
- Subscribe to RSS Feed
- Permalink
- Report Inappropriate Content
so i have 5 measures in each measure i need to add? for both the charts?
- Mark as New
- Bookmark
- Subscribe
- Mute
- Subscribe to RSS Feed
- Permalink
- Report Inappropriate Content
yes I think so
- Mark as New
- Bookmark
- Subscribe
- Mute
- Subscribe to RSS Feed
- Permalink
- Report Inappropriate Content
but still its reflecting  after adding 1 before
- Mark as New
- Bookmark
- Subscribe
- Mute
- Subscribe to RSS Feed
- Permalink
- Report Inappropriate Content
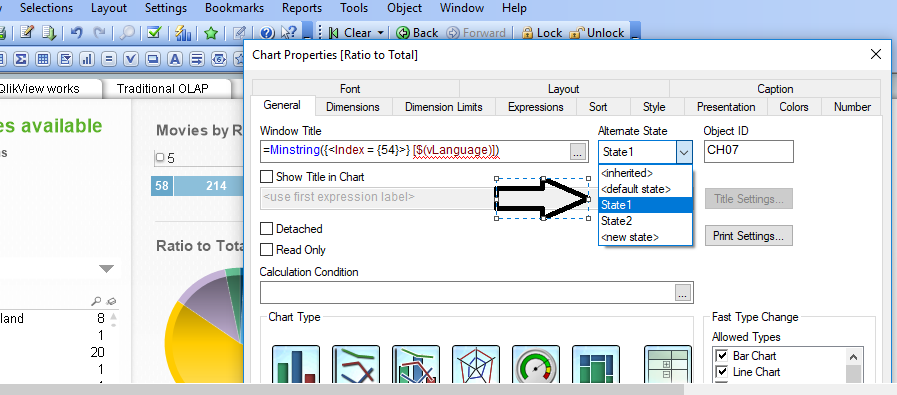
in chart purporting-> general tab
select chart1 = state1 and chart 2 = state2 like below
- Mark as New
- Bookmark
- Subscribe
- Mute
- Subscribe to RSS Feed
- Permalink
- Report Inappropriate Content
Try mentioning state name in the expression as well, like:
sum( {State1<[Type]= ,...>}
- Mark as New
- Bookmark
- Subscribe
- Mute
- Subscribe to RSS Feed
- Permalink
- Report Inappropriate Content
yes i have set for both still not working
- Mark as New
- Bookmark
- Subscribe
- Mute
- Subscribe to RSS Feed
- Permalink
- Report Inappropriate Content
Still the same reflecting.
More info:
1 its an adhoc report
in first listbox and chart i m selecting 1 dim and 1mesure its showing values
in second listbox and chart am selectng 1 dimension and 1measure the first chart is showing null dimension and some values.
- « Previous Replies
- Next Replies »