Unlock a world of possibilities! Login now and discover the exclusive benefits awaiting you.
- Qlik Community
- :
- All Forums
- :
- QlikView App Dev
- :
- Re: number
- Subscribe to RSS Feed
- Mark Topic as New
- Mark Topic as Read
- Float this Topic for Current User
- Bookmark
- Subscribe
- Mute
- Printer Friendly Page
- Mark as New
- Bookmark
- Subscribe
- Mute
- Subscribe to RSS Feed
- Permalink
- Report Inappropriate Content
number
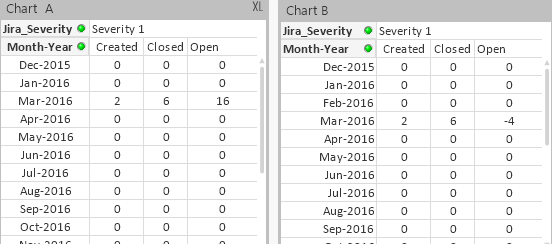
I have chart A and chart B ...
IN chart a i have clicked on any of the number then it will show me all the months and makes other zero and displays the numbers for that row only
as shown in the chart 1 ..
now i want to replresent this like chart B ..
but here the values are shwing in negative becuase i have taken out PDPeriodMonth from expression..
how do i achieve the chart B with same values and there should not be any negative values.....
Please find the attachment of the QVW file
Thanks in advance
- « Previous Replies
-
- 1
- 2
- Next Replies »
Accepted Solutions
- Mark as New
- Bookmark
- Subscribe
- Mute
- Subscribe to RSS Feed
- Permalink
- Report Inappropriate Content
Then it seems to be a problem of missing data and you need to look at this
- Mark as New
- Bookmark
- Subscribe
- Mute
- Subscribe to RSS Feed
- Permalink
- Report Inappropriate Content
I am confused what your trying to do in the chart 2 which is very much similar to the chart 1 ...could you please explain what your trying to achieve
- Mark as New
- Bookmark
- Subscribe
- Mute
- Subscribe to RSS Feed
- Permalink
- Report Inappropriate Content
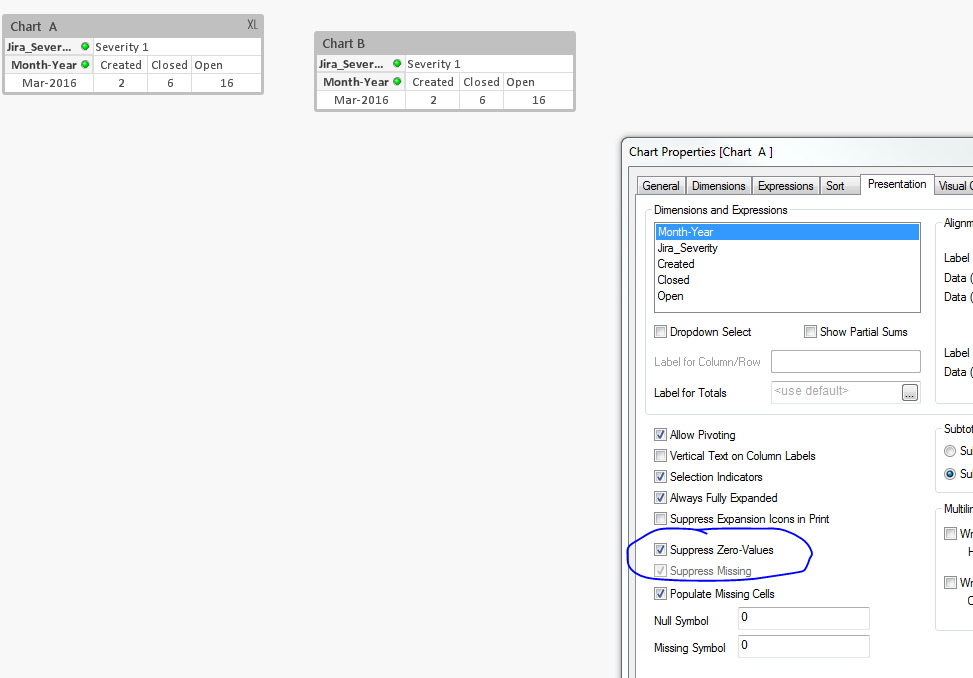
That, Means you are going to use Chart-A as excluded from current filter of field and Chart-B need to update with same recent and associate values.. Can you make Chart-B as {1} or Just do "Suppress When value is Null" from presentation tab 
Edit - And you need to check the check box like dimension as "Show All values" and Suppress should be checked.
- Mark as New
- Bookmark
- Subscribe
- Mute
- Subscribe to RSS Feed
- Permalink
- Report Inappropriate Content
HI Anil ,
This is not working when i use the below expression
RangeSum(Above(Sum({<PDReportPeriodB=>}PDRunningOpenCount), 0, RowNo()))
even after i supress the null values in presentation tab
- Mark as New
- Bookmark
- Subscribe
- Mute
- Subscribe to RSS Feed
- Permalink
- Report Inappropriate Content
You can remove that and use now as it is, Here you need to em-pose as my edit option.. Are you expecting like below?
RangeSum(Above(Sum(PDRunningOpenCount), 0, RowNo()))
- Mark as New
- Bookmark
- Subscribe
- Mute
- Subscribe to RSS Feed
- Permalink
- Report Inappropriate Content
Hi Anil ,,
I will be using one chart only not two..
I will be using always Chart A only
and will select any number from the any of the severity..
then it should show me only that row..
and the Open Expression will be RangeSum(Above(Sum({<PDReportPeriodB=>}PDRunningOpenCount), 0, RowNo()))
becuase this will always calculte the runing total ..
Thanks
- Mark as New
- Bookmark
- Subscribe
- Mute
- Subscribe to RSS Feed
- Permalink
- Report Inappropriate Content
May be you forgot to check 'Suppress Zero Values' on the presentation tab for Chart A?
- Mark as New
- Bookmark
- Subscribe
- Mute
- Subscribe to RSS Feed
- Permalink
- Report Inappropriate Content
Hi Sunny
thanks for the reply
yes this is what i want but I chart B i will be using the below expression for OPEN
RangeSum(Above(Sum({<PDReportPeriodB>}PDRunningOpenCount), 0, RowNo()))
For
which your suggested of suppressing value is not working..
Becuase the above expression will give me the perfect runing total
- Mark as New
- Bookmark
- Subscribe
- Mute
- Subscribe to RSS Feed
- Permalink
- Report Inappropriate Content
What is the number you are looking to get in chart B? Also, I thought you just wanted one chart? or do you need both charts with different outputs? What are those outputs?
- Mark as New
- Bookmark
- Subscribe
- Mute
- Subscribe to RSS Feed
- Permalink
- Report Inappropriate Content
Hi Sunny ,
I want one chart only ...
Please find the attachment of the QVW file ...
here i have one Table ..
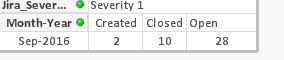
Now i will be selecting any one row from any of the Seveirty then it show me only that slection ..
as shown in the screenshot
I dont want to change my Current expression for OPEN..
I hope iam clear to some extent ..
Need your help
Thanks in advance
- « Previous Replies
-
- 1
- 2
- Next Replies »