Unlock a world of possibilities! Login now and discover the exclusive benefits awaiting you.
- Qlik Community
- :
- All Forums
- :
- QlikView App Dev
- :
- Re: % of an reference point using pivot table
- Subscribe to RSS Feed
- Mark Topic as New
- Mark Topic as Read
- Float this Topic for Current User
- Bookmark
- Subscribe
- Mute
- Printer Friendly Page
- Mark as New
- Bookmark
- Subscribe
- Mute
- Subscribe to RSS Feed
- Permalink
- Report Inappropriate Content
% of an reference point using pivot table
im tracking performance of people overtime depending on when they initially started. i call it class
the data set is like below. the first line is saying, for people started in jan, their performance is 1000 in jan, and went down to 700 in feb.
*i simplified the problem here, in the actual app, the class is a date and goes on indefinitely. so creating individual column for each class is not a good idea.
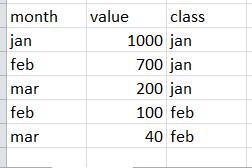
i created a pivot table looks like this in qlikview

now i need to create another pivot table like below that evaluates each month's performance relative to the first month people joined.
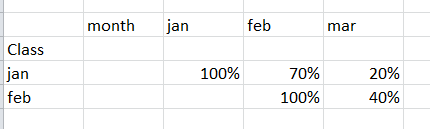
how to do that?
- Tags:
- new_to_qlikview
- Mark as New
- Bookmark
- Subscribe
- Mute
- Subscribe to RSS Feed
- Permalink
- Report Inappropriate Content
I think you will need inter-records functions like above() or before() for this, try something like this:
sum(value) / alt(before(sum(value), 1, 1), sum(value))
- Marcus
- Mark as New
- Bookmark
- Subscribe
- Mute
- Subscribe to RSS Feed
- Permalink
- Report Inappropriate Content
before () allows me to look at the previous column, but it doesn't let me reference the first column.