Unlock a world of possibilities! Login now and discover the exclusive benefits awaiting you.
- Qlik Community
- :
- All Forums
- :
- QlikView App Dev
- :
- quantile(Q1 & Q3) calculation in straight table
- Subscribe to RSS Feed
- Mark Topic as New
- Mark Topic as Read
- Float this Topic for Current User
- Bookmark
- Subscribe
- Mute
- Printer Friendly Page
- Mark as New
- Bookmark
- Subscribe
- Mute
- Subscribe to RSS Feed
- Permalink
- Report Inappropriate Content
quantile(Q1 & Q3) calculation in straight table
Hi,
I have a straight table where i am assigning each row to one category out of 4 categories based on calculation of sales increase/decrease compared to previous year in previous column expression. Then i want to calculate the q1 ans q3 quantiles for each category assigned in the straight table. i am aware fractile command can be used to calculate the quantiles values but i am not successful in calculating this.
i am adding a new expression in the straight table where i wanted to calculate the q1 and q3 for each category but i am not sure if this is the way to approach it. Please suggest the best way to achieve it.
-Srividya
- Mark as New
- Bookmark
- Subscribe
- Mute
- Subscribe to RSS Feed
- Permalink
- Report Inappropriate Content
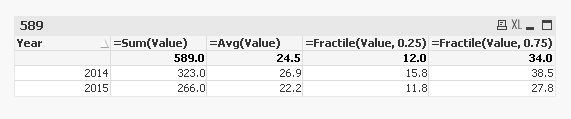
You might have missed the 2nd Argument:
For 1st Quartile: Fractile(YourField, 0.25)
For 3rd Quartile: Fractile(YourField, 0.75)
- Mark as New
- Bookmark
- Subscribe
- Mute
- Subscribe to RSS Feed
- Permalink
- Report Inappropriate Content
Hi Sunny,
I have applied the formula: fractile(sales,0.25) as an expression in the straight table where sales is also a expression and i get "-" in every row of the fractile column.
- Mark as New
- Bookmark
- Subscribe
- Mute
- Subscribe to RSS Feed
- Permalink
- Report Inappropriate Content
Attaching a sample sample for you.
Script:
Table:
Table:
LOAD Date,
MonthName(Date) as MonthYear,
Year(Date) as Year,
Month(Date) as Month,
Ceil(Rand() * 50) as Value;
LOAD * Inline [
Date
01/01/2014
02/01/2014
03/01/2014
04/01/2014
05/01/2014
06/01/2014
07/01/2014
08/01/2014
09/01/2014
10/01/2014
11/01/2014
12/01/2014
01/01/2015
02/01/2015
03/01/2015
04/01/2015
05/01/2015
06/01/2015
07/01/2015
08/01/2015
09/01/2015
10/01/2015
11/01/2015
12/01/2015
];
- Mark as New
- Bookmark
- Subscribe
- Mute
- Subscribe to RSS Feed
- Permalink
- Report Inappropriate Content
It seems that you are trying to use an expression label "sales" in the fractile function, which I believe will not work.
Maybe you need advanced aggregation (aggr() function) here to enable you to apply fractile() on a custom table (like categorized sales values). Or maybe you can do the categorization in the script and use fractile() with a set analysis filter.
It's a bit unclear to me what you are trying to achieve and how your setting looks like.
Could you upload a small sample QVW?
- Mark as New
- Bookmark
- Subscribe
- Mute
- Subscribe to RSS Feed
- Permalink
- Report Inappropriate Content
Hi,
attached file. I am selecting country in the 2nd sheet intra 80% where i select the top 80% contributors to sales. cllicking on the button rediects to the 3rd sheet where i plot graphs of these contributors and i need to assign them to high,medium and low risk categories by assigning a color to each of high,medium and low risk in graph. i need to calculate the quartiles on the YOY expression for the Top Revenue decline contributors.
Hope i have made myself clear.
- Mark as New
- Bookmark
- Subscribe
- Mute
- Subscribe to RSS Feed
- Permalink
- Report Inappropriate Content
I don't see anything attached
- Mark as New
- Bookmark
- Subscribe
- Mute
- Subscribe to RSS Feed
- Permalink
- Report Inappropriate Content
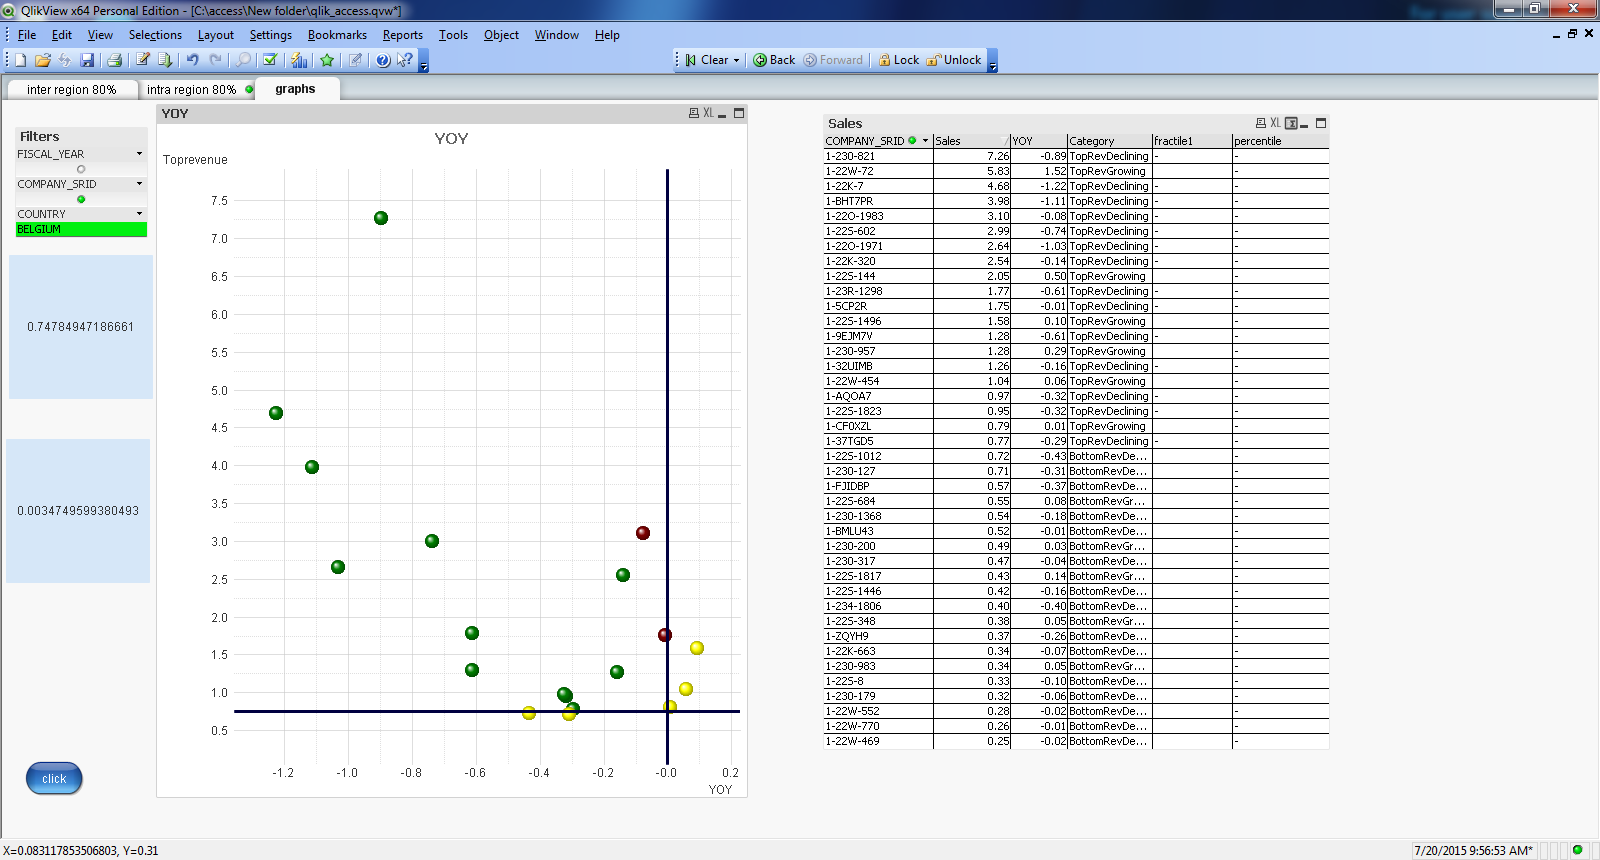
Sorry! qvw not uploading.. i have attached an image to explain the scenario. the points in the scatterplot is the ID of the contributors which fall in the Top Revenue declining category.
calculation of YOY used: (Sum({<Fiscal_Half={"$(vFiscalHalf2)"}>} Sales_Out))-(Sum({<Fiscal_Half={"$(vFiscalHalf1)"}>} Sales_Out))
I am unable to calculate the quantiles in the script as it needs to be done dynamically when a particular country is selected.
I am considering to calculate the quantiles of YOY expression and store it in a variable using macro. then the variable vallue can be used in the graph to set different color to high ,medium n low risk areas depending of the q1 and q3 quartiles.