Unlock a world of possibilities! Login now and discover the exclusive benefits awaiting you.
- Qlik Community
- :
- All Forums
- :
- QlikView App Dev
- :
- "Show all values" on axis with dual() in Field Gro...
- Subscribe to RSS Feed
- Mark Topic as New
- Mark Topic as Read
- Float this Topic for Current User
- Bookmark
- Subscribe
- Mute
- Printer Friendly Page
- Mark as New
- Bookmark
- Subscribe
- Mute
- Subscribe to RSS Feed
- Permalink
- Report Inappropriate Content
"Show all values" on axis with dual() in Field Group
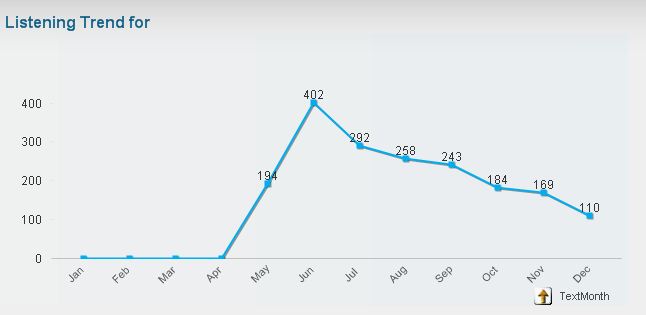
I created a 3-level field of a time hierarchy to display on my x-axis.
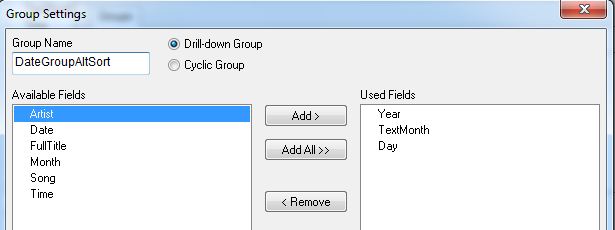
The definition of the 3 levels is:
- Year
- Dual(TextMonth, Month)
- Day
My intent here was to have "Jan", "Feb", etc display for the months, but have them sorted by 01, 02, etc on the axes. That was all working fine.
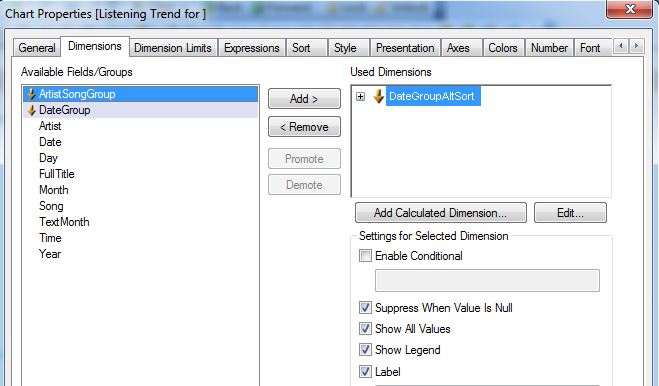
However, when I choose "Show All Values" on the Dimensions page to ensure that all dates appear on the graph (even if they have no data), it works for Year and Day, but not for the Dual field of the months.
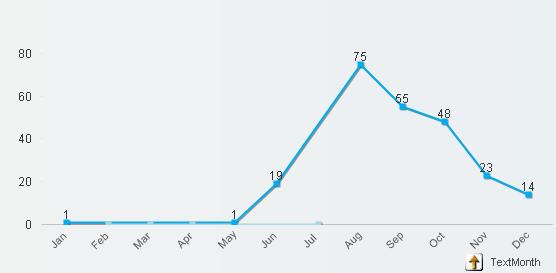
I have attached a QVW to show this. You can see the 0-value years showing on the x-axis of the line chart. If you click a year with data, it drills to the months but will only display the ones that are non-zero. Then if you click another to drill to days, it returns to showing zero-values again.
Any help is appreciated. Thanks!
Accepted Solutions
- Mark as New
- Bookmark
- Subscribe
- Mute
- Subscribe to RSS Feed
- Permalink
- Report Inappropriate Content
Hi Bill,
one solution could be:
LOAD Artist,
    Song,
    Date,
    Time,
    FullTitle,
    Year,
    Month,
    Day,
    Date#(TextMonth, 'MMM') as TextMonth
FROM
QlikCommunity_Thread_121957.csv
(txt, utf8, embedded labels, delimiter is ',', msq);
(in your script you would change "@9 as TextMonth" into "Date#(@9, 'MMM') as TextMonth")
hope this helps
regards
Marco
- Mark as New
- Bookmark
- Subscribe
- Mute
- Subscribe to RSS Feed
- Permalink
- Report Inappropriate Content
Any ideas? Is there a better forum to place this question than this?
- Mark as New
- Bookmark
- Subscribe
- Mute
- Subscribe to RSS Feed
- Permalink
- Report Inappropriate Content
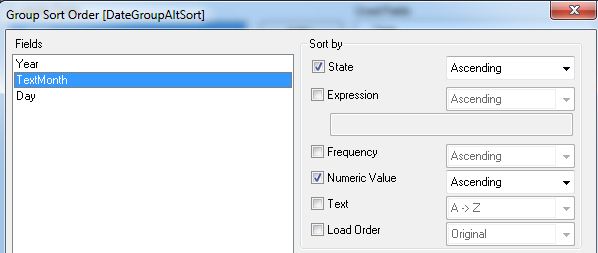
The first thing I would probably try is take the Dual out, and leave TextMonth as the dimension. In the sorting for TextMonth, check 'Expression' and put '=Month'. Hopefully this will help.
- Mark as New
- Bookmark
- Subscribe
- Mute
- Subscribe to RSS Feed
- Permalink
- Report Inappropriate Content
Hi Bill,
You'll need a Calender dimension. The problem is that you don't have the data. So what you can do best is adding this calender and uses that one as dimension (don't forget to check "zero on bars" in the presentation tab of the properties).
/* Calender */
UNQUALIFY *;
LET vBeginYear = 2004;
LET vEndYear = 2014;
FOR i = 1 TO ($(vEndYear)-$(vBeginYear))+1;
LET vStartCalender = DAYSTART(MAKEDATE($(vBeginYear)+($(i)-1)));
LET vEndCalender = DAYSTART(YEAREND(vStartCalender));
LET TotalDays = (vEndCalender - vStartCalender) + 2;
LET vToday = DATE(TODAY(),'YYYY-MM-DD');
//Create a temporary calendar
TempCalendar:
LOAD
DATE(DAYSTART('$(vStartCalender)' + RECNO() - 1), 'YYYY-MM-DD') AS Date
AUTOGENERATE(TotalDays - 1);
NEXT i
Calendar:
LOAD
DATE(Date,'YYYY-MM-DD') AS Date,
YEAR(Date) AS Year,
MONTH(Date) AS Month,
RIGHT('00'&IF(DAYNUMBEROFYEAR(Date)<=7 AND WEEK(Date)>2,1,IF(DAYNUMBEROFYEAR(Date)>=358 AND WEEK(Date)<2,53,WEEK(Date))),2) AS Week,
RIGHT('00'&WEEK(Date),2) AS ISO_Week,
DAY(Date) AS Day
WEEKDAY(Date) AS WeekDay
RESIDENT TempCalendar;
DROP TABLE TempCalendar;
- Mark as New
- Bookmark
- Subscribe
- Mute
- Subscribe to RSS Feed
- Permalink
- Report Inappropriate Content
Hi Anton,
I tried adding this into my scripts just now. I can see that it generated OK and linked to my other tables on Date, Year, Month, and Day. I also see that the calendar generation worked in that I now have a 2004 year point on my chart (with a zero value) since my raw data only goes down to 2005.
However, I am still seeing the same behavior with the Months display. Months with 0 values are excluded from the axis. I also tried removing the dual, as suggested by Josh and that had no effect either. I am seeing the same results as the original - Years and Days display fine with zero values, Months are missing.
- Mark as New
- Bookmark
- Subscribe
- Mute
- Subscribe to RSS Feed
- Permalink
- Report Inappropriate Content
Thanks, Josh - I just tried this, and as stated below in my reply to Anton, I am still seeing the same behavior.
- Mark as New
- Bookmark
- Subscribe
- Mute
- Subscribe to RSS Feed
- Permalink
- Report Inappropriate Content
Hi Bill,
one solution could be:
LOAD Artist,
    Song,
    Date,
    Time,
    FullTitle,
    Year,
    Month,
    Day,
    Date#(TextMonth, 'MMM') as TextMonth
FROM
QlikCommunity_Thread_121957.csv
(txt, utf8, embedded labels, delimiter is ',', msq);
(in your script you would change "@9 as TextMonth" into "Date#(@9, 'MMM') as TextMonth")
hope this helps
regards
Marco
- Mark as New
- Bookmark
- Subscribe
- Mute
- Subscribe to RSS Feed
- Permalink
- Report Inappropriate Content
Thank you, Marco - that did work!
Two follow up questions:
1) Out of curiosity, why did that work but the original configuration not? I'd like to understand as much as I can what is going on in the background.
2) Is there any way to get the line graph to go back down to zero in the intermediate months without data? Like for JUL in the attached image, for example.