Unlock a world of possibilities! Login now and discover the exclusive benefits awaiting you.
- Qlik Community
- :
- All Forums
- :
- QlikView App Dev
- :
- rolling average
- Subscribe to RSS Feed
- Mark Topic as New
- Mark Topic as Read
- Float this Topic for Current User
- Bookmark
- Subscribe
- Mute
- Printer Friendly Page
- Mark as New
- Bookmark
- Subscribe
- Mute
- Subscribe to RSS Feed
- Permalink
- Report Inappropriate Content
rolling average
Hello. I need help with rolling 12M average and having rangeavg() function work on filters for specific periods. Please see attachment .qyw for problem description and desired output. Any help would be appreciated!
Accepted Solutions
- Mark as New
- Bookmark
- Subscribe
- Mute
- Subscribe to RSS Feed
- Permalink
- Report Inappropriate Content
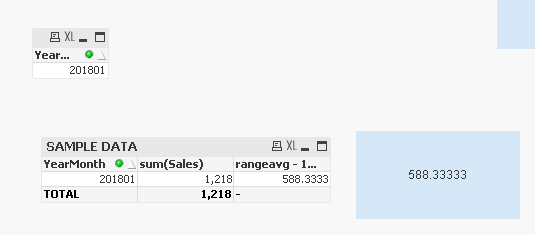
Try this for a text box object
=Avg({<YearMonth = {"$(='>=' & (Max(YearMonth) - 100) & '<=' & Max(YearMonth))"}>} Aggr(Sum({<YearMonth = {"$(='>' & (Max(YearMonth) - 100) & '<=' & Max(YearMonth))"}>} Sales), YearMonth))
- Mark as New
- Bookmark
- Subscribe
- Mute
- Subscribe to RSS Feed
- Permalink
- Report Inappropriate Content
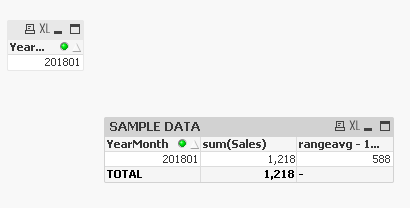
Try this expression
RangeAvg(Above(Sum({<YearMonth>} Sales), 0, 12)) * Avg(1)
- Mark as New
- Bookmark
- Subscribe
- Mute
- Subscribe to RSS Feed
- Permalink
- Report Inappropriate Content
Hi stalwar1
Thanks, that works great for table view with dimension but I also need to get it to properly show the desired value as a stand alone expression result without dimensions (like in a text box) as I need to reference the value in another calculation. Now it shows 9360 if I put the expression there. Is this possible to solve? See picture and attachment qvw.. 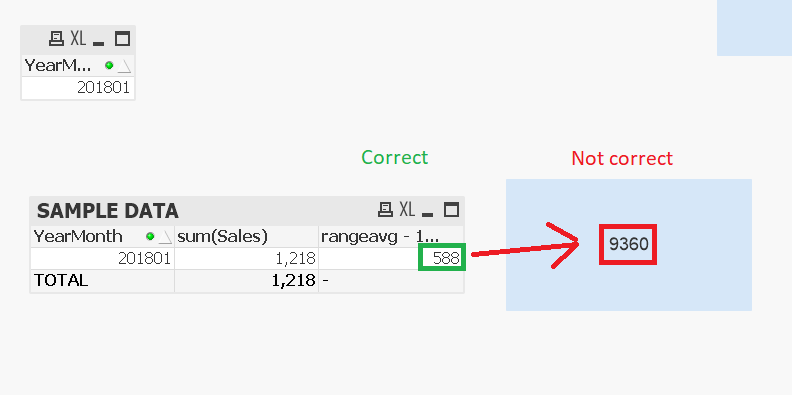
- Mark as New
- Bookmark
- Subscribe
- Mute
- Subscribe to RSS Feed
- Permalink
- Report Inappropriate Content
Try this for a text box object
=Avg({<YearMonth = {"$(='>=' & (Max(YearMonth) - 100) & '<=' & Max(YearMonth))"}>} Aggr(Sum({<YearMonth = {"$(='>' & (Max(YearMonth) - 100) & '<=' & Max(YearMonth))"}>} Sales), YearMonth))
- Mark as New
- Bookmark
- Subscribe
- Mute
- Subscribe to RSS Feed
- Permalink
- Report Inappropriate Content
Thank you Sunny, that works perfectly.