Unlock a world of possibilities! Login now and discover the exclusive benefits awaiting you.
- Qlik Community
- :
- All Forums
- :
- QlikView App Dev
- :
- Re: show current and previous 2 months.
- Subscribe to RSS Feed
- Mark Topic as New
- Mark Topic as Read
- Float this Topic for Current User
- Bookmark
- Subscribe
- Mute
- Printer Friendly Page
- Mark as New
- Bookmark
- Subscribe
- Mute
- Subscribe to RSS Feed
- Permalink
- Report Inappropriate Content
show current and previous 2 months.
Hi,
I am trying to create a bar graph that shows the count(month) but does not show any data from two months prior to the current date. I have my dimension as Month and Expression as count(month). That shows the graph with the correct numbers but i would like to only show the previous two month from the current date. I tried to create another expressions Sum({<Month={"$(=Max(Month)-2)"}>}[Month] but I think its wrong.
Any help is appreciated.
Thank you
- « Previous Replies
-
- 1
- 2
- Next Replies »
- Mark as New
- Bookmark
- Subscribe
- Mute
- Subscribe to RSS Feed
- Permalink
- Report Inappropriate Content
Topic Area | NumCompDate | ows_ComDate | CompDateMonth |
| #Agri Commodity Definition | 2011-09-12 00:00:00 | 9/12/2011 | Sep |
| #Agri Swaps | 2012-10-12 00:00:00 | 10/12/2012 | Oct |
| #Amend to July 14, 2011 Order for Swap Regulation | 2011-12-23 00:00:00 | 12/23/2011 | Dec |
| #Amend to CPO and CTA Regulations Resulting from DF Act | 2012-11-05 00:00:00 | 11/5/2012 | Nov |
| #Amend to CPO and CTA Regulations Resulting from DF Act | |||
| #Ben Ownership Reporting Requirements and Security-Based Swaps | 2011-07-16 00:00:00 | 7/16/2011 | Jul |
| #Business Affiliate Marketing and Disposal of Consumer Information Rules | 2012-09-21 00:00:00 | 9/21/2012 | Sep |
#Business Affiliate Marketing and Disposal of Consumer Information Rules | |||
| #Clearing Exemption for Swaps Between Certain Affiliated Entities | |||
| #Commodity Options | 2012-10-12 00:00:00 | 10/12/2012 | Oct |
- Mark as New
- Bookmark
- Subscribe
- Mute
- Subscribe to RSS Feed
- Permalink
- Report Inappropriate Content
HI
Try like this
=Count({<DateField={">=$(=AddMonths(Max(DateField),-2))"}>} CountField )
Its takes max(DateField) for example 05/11/2012 format DD/MM/YYYY
Calculate dated from 05/09/2012 to 05/11/2012 and count the values
Suppose want to calcualte from 01/09/2012 to 05/11/2012 , use MonthStart(AddMonths(Max(DateField),-2))
Hope that helps
Please close the thread by marking correct answer & give likes if you like the post.
- Mark as New
- Bookmark
- Subscribe
- Mute
- Subscribe to RSS Feed
- Permalink
- Report Inappropriate Content
Hi,
I tried the expression but again nothing. Keep getting an error message--> "no data to display."
When I use this expression :
Count({<ComplianceDateMonth={">=$(=AddMonths(Max(ComplianceDateMonth),-2))"}>} [ComplianceDateMonth]
) I get a bar graph but with every date from sep-2010 to mar-2014 listed. The dimension I use is a datemonth field (shows MM-YYYY). It still is not showing the current date and past 2 months. 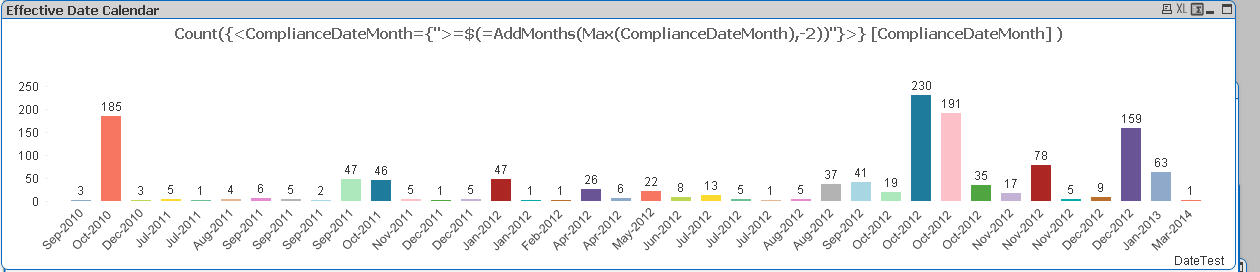
- Mark as New
- Bookmark
- Subscribe
- Mute
- Subscribe to RSS Feed
- Permalink
- Report Inappropriate Content
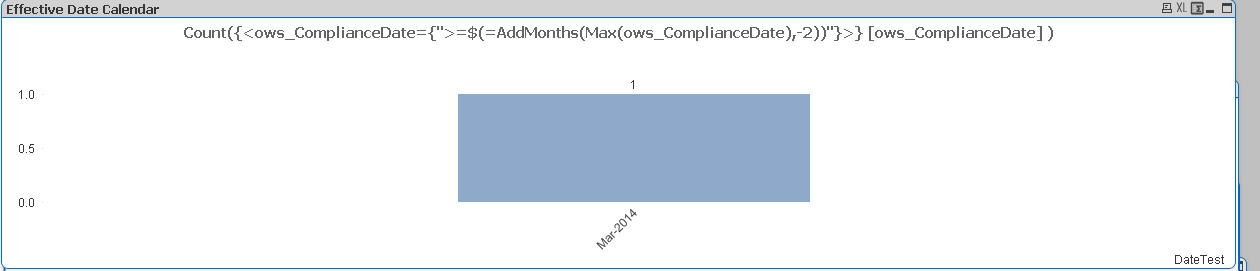
Hi
Instead of using
[ComplianceDateMonth] field , can you able to use Datefield(i.e. not the monthYear field but date field in the expression)
Hope that helps
Please close the thread by marking correct answer & give likes if you like the post.
- Mark as New
- Bookmark
- Subscribe
- Mute
- Subscribe to RSS Feed
- Permalink
- Report Inappropriate Content
- Mark as New
- Bookmark
- Subscribe
- Mute
- Subscribe to RSS Feed
- Permalink
- Report Inappropriate Content
Hi .. Look this example ...
I hope it can be useful for you
Gabriel
- Mark as New
- Bookmark
- Subscribe
- Mute
- Subscribe to RSS Feed
- Permalink
- Report Inappropriate Content
Thank you. I have figured it out.
Also thank you Mayil Vahanan. I would not have understood this without your imput.
- « Previous Replies
-
- 1
- 2
- Next Replies »