Unlock a world of possibilities! Login now and discover the exclusive benefits awaiting you.
- Qlik Community
- :
- All Forums
- :
- QlikView App Dev
- :
- what about macco chart?
- Subscribe to RSS Feed
- Mark Topic as New
- Mark Topic as Read
- Float this Topic for Current User
- Bookmark
- Subscribe
- Mute
- Printer Friendly Page
- Mark as New
- Bookmark
- Subscribe
- Mute
- Subscribe to RSS Feed
- Permalink
- Report Inappropriate Content
what about macco chart?
Any one can tell me what is the purpose of macco chart
- Tags:
- new_to_qlikview
- « Previous Replies
-
- 1
- 2
- Next Replies »
- Mark as New
- Bookmark
- Subscribe
- Mute
- Subscribe to RSS Feed
- Permalink
- Report Inappropriate Content
- Mark as New
- Bookmark
- Subscribe
- Mute
- Subscribe to RSS Feed
- Permalink
- Report Inappropriate Content
Hi Santosh,
a mekko chart is basically very similar to a barchart with a second dimension with virtually no gaps between the columns 😉
There are segments (stacked, or at least it is so in my book) for every value of the second dimension.
The width of the columns varies depending on the value in relation to the total (on the first dimension).
I have never used it, I tend to always stick to the easiest chart that will serve the purpose - my company is in the 2nd economic sector and there are a lot of people who are not anything like nerds, so the simpler things are, the better.
- Mark as New
- Bookmark
- Subscribe
- Mute
- Subscribe to RSS Feed
- Permalink
- Report Inappropriate Content
Dear Santosh,
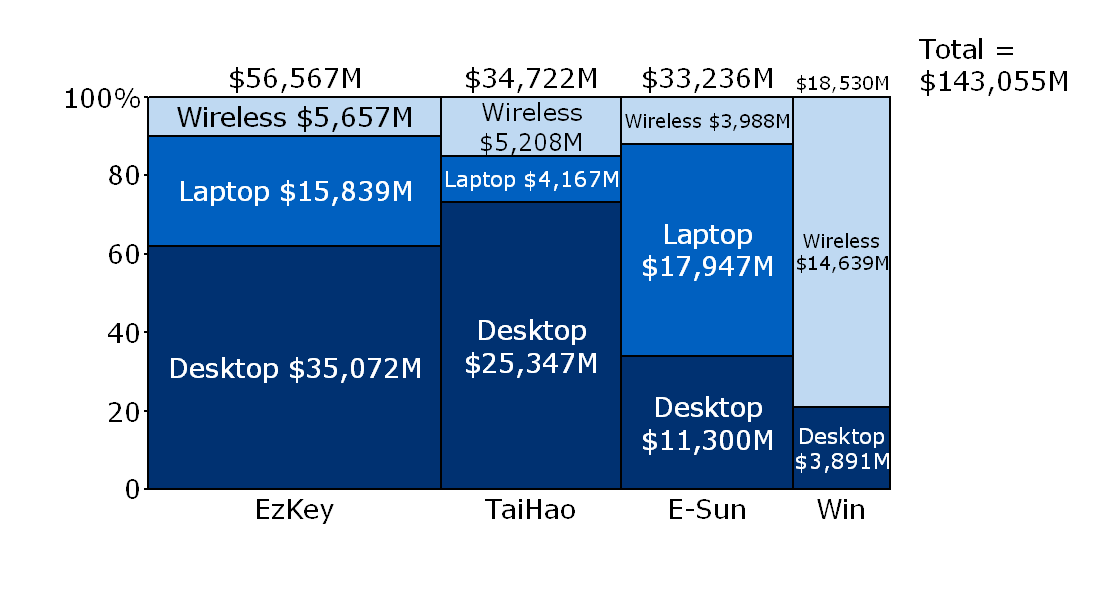
Mekko charts present data using variable width bars. They can display up to three levels of data in a two-dimensional chart. Mekko charts are useful in such areas as market analysis.
Example:
Kind regards,
Ishfaque Ahmed
- Mark as New
- Bookmark
- Subscribe
- Mute
- Subscribe to RSS Feed
- Permalink
- Report Inappropriate Content
Hi Santosh,
I personaly love mekko charts. They represent the following information:
1) Size of the block is the precentage of the grand total.
2) You can customize the colours as well. Which by one glance you can imidiately see problems.
Regards,
Marius
- Mark as New
- Bookmark
- Subscribe
- Mute
- Subscribe to RSS Feed
- Permalink
- Report Inappropriate Content
Hi.
As it can be seen in the graph they've posted above, the difference with a bar chart is not only the width of the bar; let's look at the scale. It goes from 0 to 1, that means each bar is visualy telling the proportion between the stacked dimension. So, for the value EzKey, Desktop is like a 62%, Laptop 28% and Wireless arround 10%. It's visual. If you want to have the % number you'll need to do a division over the total for each value of the lower dimension.
Therefore, it's not just like a barchart. I'd say it's more similar to a block chart, but aligning dimension's values.
- Mark as New
- Bookmark
- Subscribe
- Mute
- Subscribe to RSS Feed
- Permalink
- Report Inappropriate Content
Hi again.
The fact of all columns having the same height makes absolutely necessary to vary the width
- Mark as New
- Bookmark
- Subscribe
- Mute
- Subscribe to RSS Feed
- Permalink
- Report Inappropriate Content
Hi Santosh
Mekko charts will show the data using variable width bars. They can display up to three levels of data in a two-dimensional chart. Mekko charts are useful in Stock market kind of statics.
- Mark as New
- Bookmark
- Subscribe
- Mute
- Subscribe to RSS Feed
- Permalink
- Report Inappropriate Content
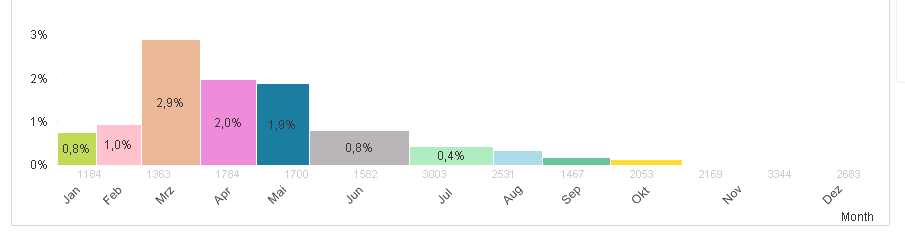
Hello everyone,
I would like to use Marimekko Chart and I am able to show the data correctly. The Problem is the alignment of the axis-text (Numbers shown above of the axis like 1184, 1363, 1784...). As you can see as well, the Text are not well aligned to their Bars correspondingly. The more bars, the worse alignment...
How could I fix the alignment issue?
Regards,
Gokhan
- « Previous Replies
-
- 1
- 2
- Next Replies »