Unlock a world of possibilities! Login now and discover the exclusive benefits awaiting you.
- Qlik Community
- :
- All Forums
- :
- QlikView App Dev
- :
- Re: y axes not showing in percent (using Dual)
- Subscribe to RSS Feed
- Mark Topic as New
- Mark Topic as Read
- Float this Topic for Current User
- Bookmark
- Subscribe
- Mute
- Printer Friendly Page
- Mark as New
- Bookmark
- Subscribe
- Mute
- Subscribe to RSS Feed
- Permalink
- Report Inappropriate Content
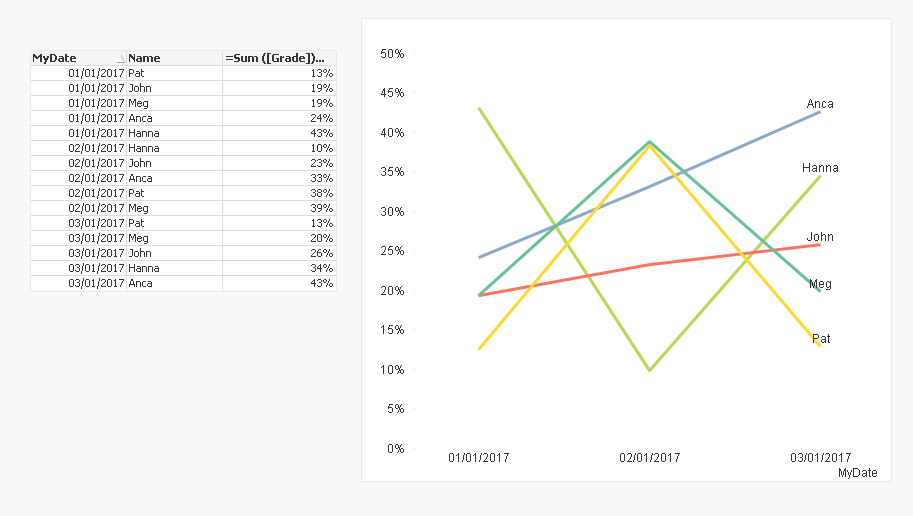
y axes not showing in percent (using Dual)
How can I have y axes showing as percent
If I try to change format setting from the Number tab the dual function will not work anymore,
so guess need a solution within the Dual function,
=Dual(
If(MyDate=Max(total MyDate), Name, ''),
Sum ([Grade])/Max(Total Aggr(Sum([Grade]), [Name]))
)
Thanks
Raphael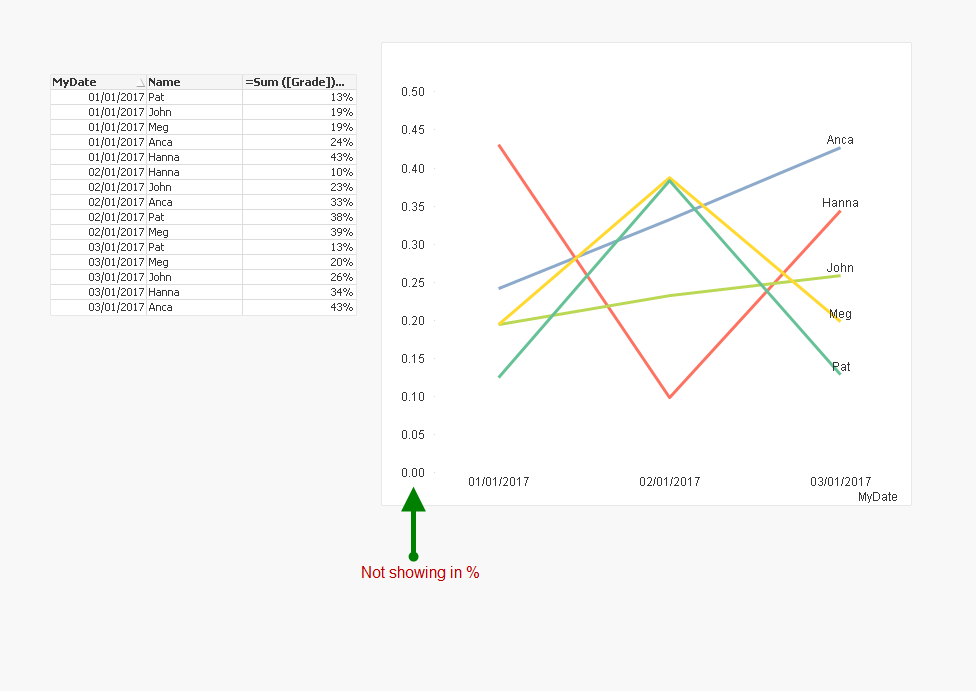
- « Previous Replies
-
- 1
- 2
- Next Replies »
Accepted Solutions
- Mark as New
- Bookmark
- Subscribe
- Mute
- Subscribe to RSS Feed
- Permalink
- Report Inappropriate Content
- Mark as New
- Bookmark
- Subscribe
- Mute
- Subscribe to RSS Feed
- Permalink
- Report Inappropriate Content
Hi
PFA the desired app.
Regards
Pratyush
- Mark as New
- Bookmark
- Subscribe
- Mute
- Subscribe to RSS Feed
- Permalink
- Report Inappropriate Content
No good 
As I said:"If I try to change format setting from the Number tab the dual function will not work anymore,"
so in your solution we do not have the legend on the line of the Graph! but thanks for trying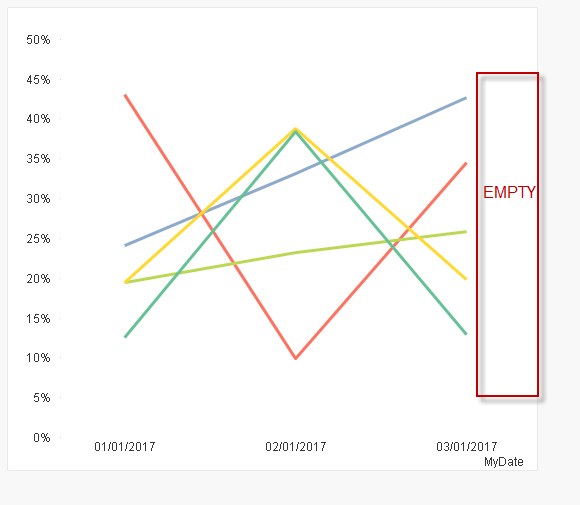
- Mark as New
- Bookmark
- Subscribe
- Mute
- Subscribe to RSS Feed
- Permalink
- Report Inappropriate Content
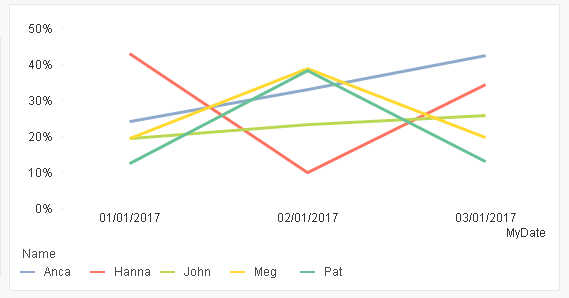
Are you going to have this?
- Mark as New
- Bookmark
- Subscribe
- Mute
- Subscribe to RSS Feed
- Permalink
- Report Inappropriate Content
no here too the legend is not on the line, have a look on the right (the names)
- Mark as New
- Bookmark
- Subscribe
- Mute
- Subscribe to RSS Feed
- Permalink
- Report Inappropriate Content
Would putting % on the data points be an option? Like:
- Mark as New
- Bookmark
- Subscribe
- Mute
- Subscribe to RSS Feed
- Permalink
- Report Inappropriate Content
I have many observations , so do not want to show the percents on the line, but rather just the Legend at the end and the y axes as Percent
- Mark as New
- Bookmark
- Subscribe
- Mute
- Subscribe to RSS Feed
- Permalink
- Report Inappropriate Content
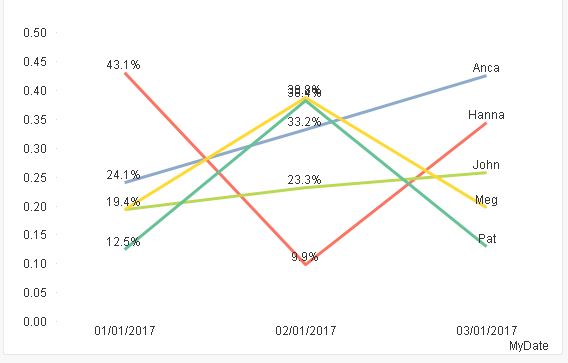
Is this what you are after?
- Mark as New
- Bookmark
- Subscribe
- Mute
- Subscribe to RSS Feed
- Permalink
- Report Inappropriate Content
yes, still trying to understand how you did 
- Mark as New
- Bookmark
- Subscribe
- Mute
- Subscribe to RSS Feed
- Permalink
- Report Inappropriate Content
Created a second expression for putting the name
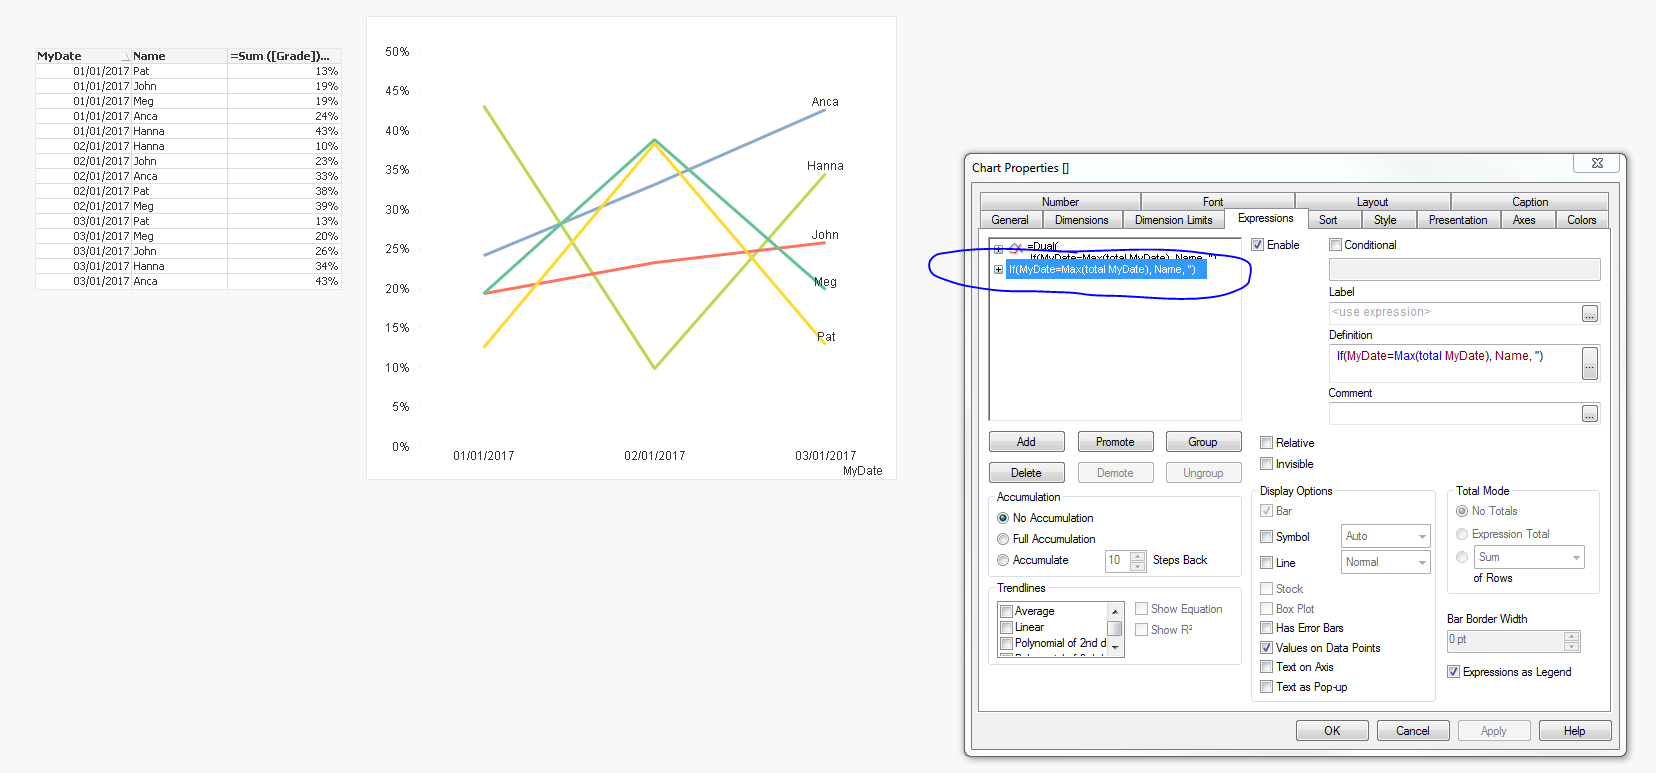
If you see for display option, Line is unchecked and only Values on Data Points is checked. This expression shows the name, while the first expression handles the axis and the line
- « Previous Replies
-
- 1
- 2
- Next Replies »