Unlock a world of possibilities! Login now and discover the exclusive benefits awaiting you.
- Qlik Community
- :
- Discover
- :
- Programs
- :
- Academic Program
- :
- Qlik Academic Program
- :
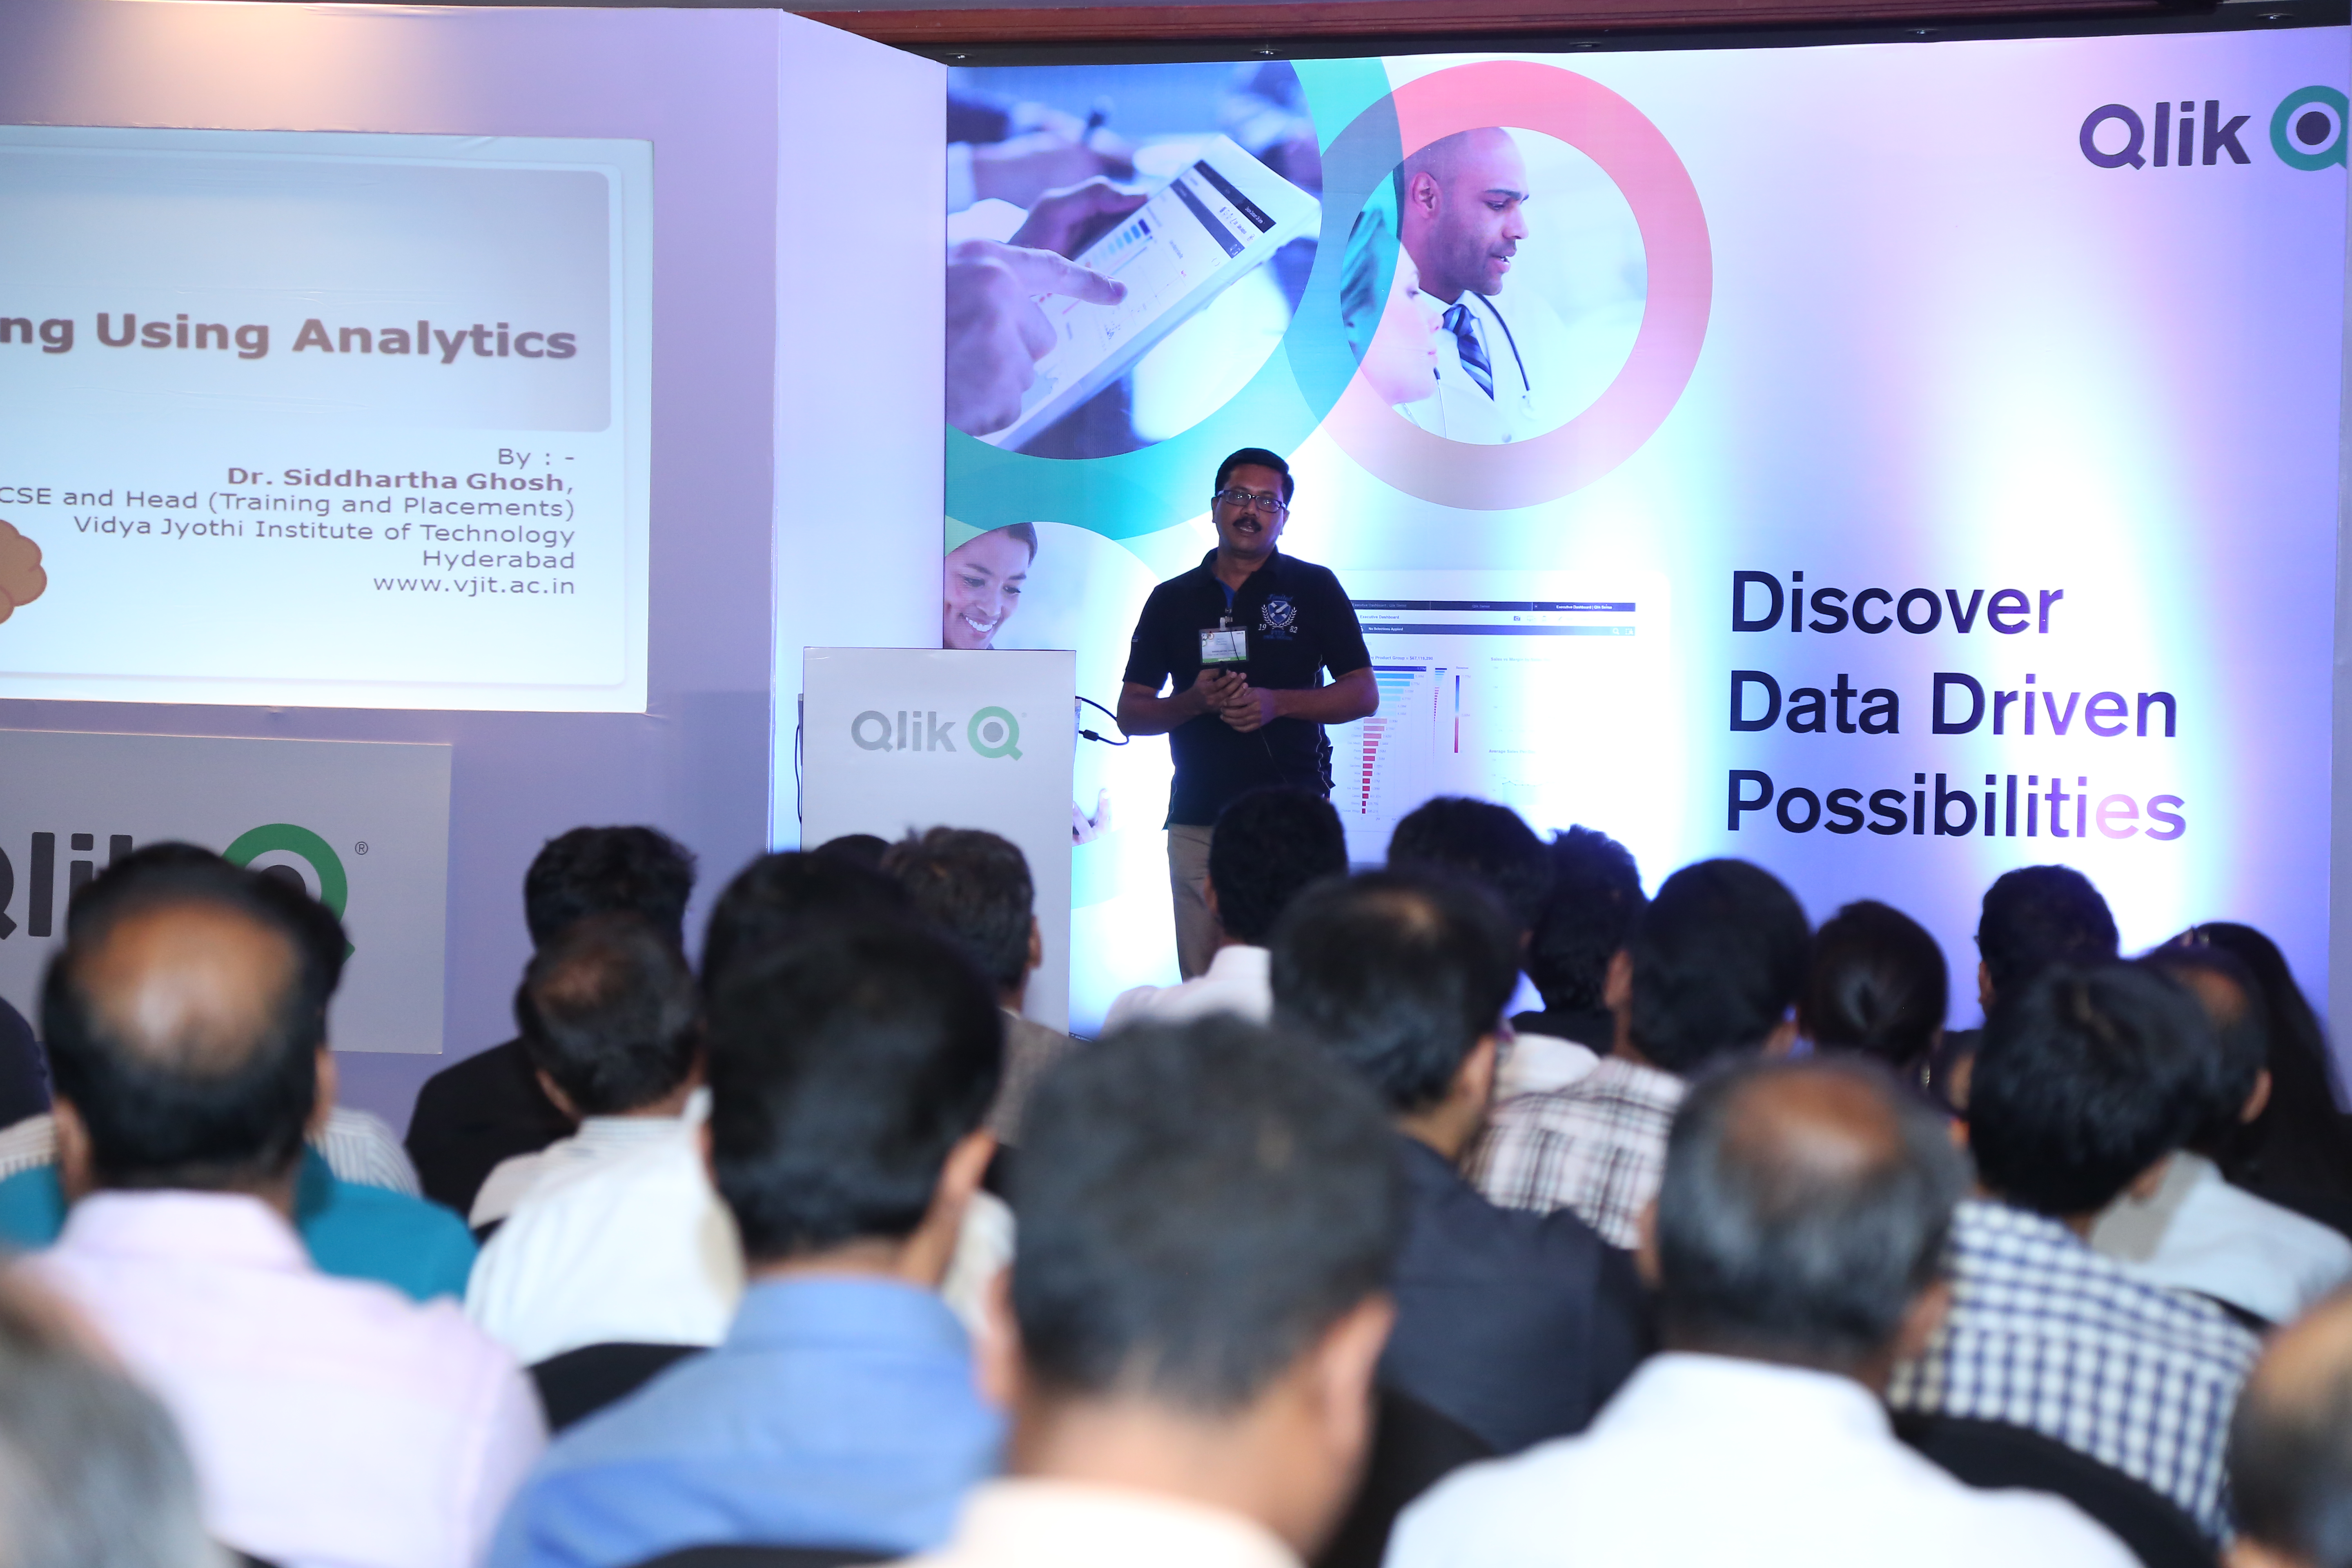
- Dr Ghosh speaks on Competing using Analytics at Ba...
- Subscribe to RSS Feed
- Mark as New
- Mark as Read
- Bookmark
- Subscribe
- Printer Friendly Page
- Report Inappropriate Content

Dr. Siddhartha Ghosh from Vidya Jyothi Institute of Technology ( VJIT), spoke at a Qlik organized event in Bangalore, themed "Discover data driven possibilities" on 26th April. VJIT has partnered with The Qlik Academic Program
This event was attended by more than 100 Qlik customers and prospects. Dr. Ghosh spoke on applications of Qlik Sense for students of data analytics and administration of educational institutions covering areas such as placements, online test and results analysis.
Dr Ghosh had the following thoughts to share:
In the academic arena, Qlik Sense cloud may play a key role for :
- From traditional offline analytics to in-line embedded analytics .This has been the focus for many efforts in the past and will continue to be an important focus for analytics.
- From analyzing historical data (students data, staff data) to explain what happened to analyzing historical and real-time data from multiple systems to simulate and predict the future.
- From Structured and simple data analyzed by individuals to analysis of complex information of many types(text, video) from many system supporting a collaborative decision process that bring multiple people together top analyze, brainstorm and make decisions.
Application of data analytics in Educational Institutions:
- Use of Qlik Sense as a data analytics tool for teaching analytics for B.Tech. CSE/IT students.
- Placement Data Analysis – Details of students recruited every year from the college in different companies can be represented in single pictorial format. Details such as salary package, number of students who got selected in particular company can be represented.
- Online test results analysis – Marks scored by individual students in each consecutive tests conducted in the college can be easily shown.
- Results Data Anlysis – Marks and grades scored by individual student in every semester and over all percentage of every department can be shown. Comparison of individual department percentages can be done through combo charts. Many other hidden information comes out while using Qlik Sense for academic results.
- Faculty data – We can also analyze faculty information and data in simple way using this technology.
Job perspective:
In the field of data visualization and data analytics, there is a huge demand for resources that have created many opportunities. Qlik View is a wonderful tool and have many simple functionalities to create a perfect data model. It is a simple tool to understand and can also be implemented in a smooth way. Freshers or B.Tech. (CSE/IT) graduate students gaining knowledge of Qlik technologies is a great value edition on their biodata.
You must be a registered user to add a comment. If you've already registered, sign in. Otherwise, register and sign in.