Unlock a world of possibilities! Login now and discover the exclusive benefits awaiting you.
Announcements
Live today at 11 AM ET. Get your questions about Qlik Connect answered, or just listen in.
SIGN UP NOW
- Qlik Community
- :
- Forums
- :
- Groups
- :
- Location and Language
- :
- Brasil
- :
- Re: Gráfico de barras em percentual
Options
- Subscribe to RSS Feed
- Mark Topic as New
- Mark Topic as Read
- Float this Topic for Current User
- Bookmark
- Subscribe
- Mute
- Printer Friendly Page
- Feature this Topic
Turn on suggestions
Auto-suggest helps you quickly narrow down your search results by suggesting possible matches as you type.
Showing results for
Not applicable
2016-12-15
08:34 PM
- Mark as New
- Bookmark
- Subscribe
- Mute
- Subscribe to RSS Feed
- Permalink
- Report Inappropriate Content
Gráfico de barras em percentual
Como fazer para um gráfico de barras mostrar valores em percentual?
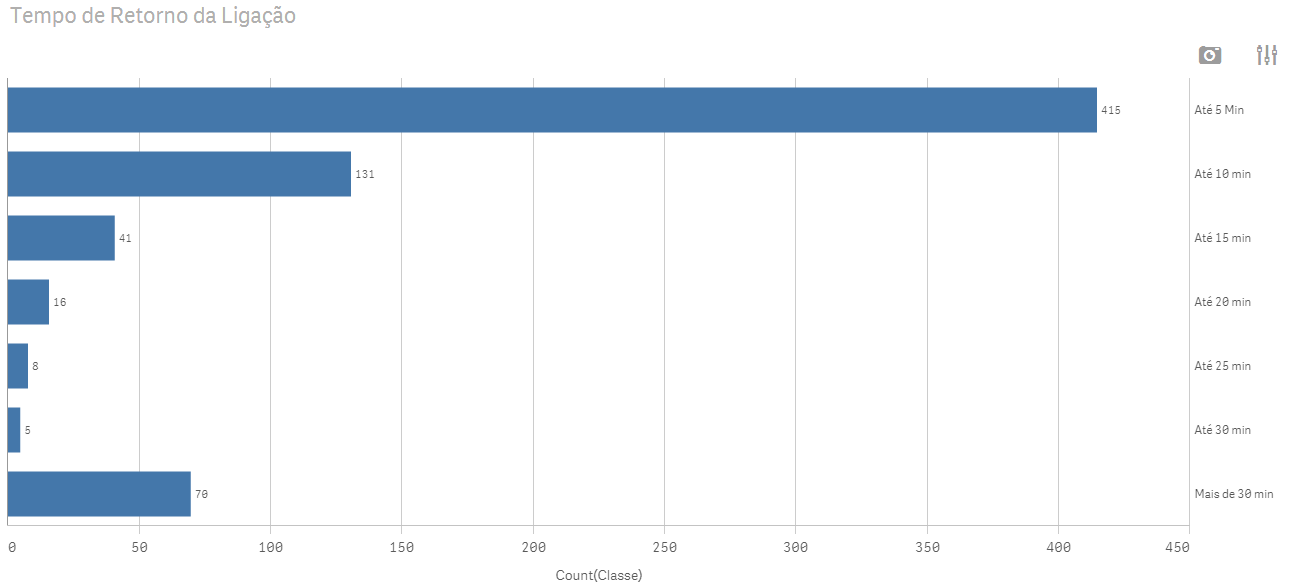
No exemplo:
Dimensão = Classe
Medida = Count(Classe)
Agradeço antecipadamente as respostas.
1,464 Views
1 Solution
Accepted Solutions
Master III
2016-12-16
02:07 AM
- Mark as New
- Bookmark
- Subscribe
- Mute
- Subscribe to RSS Feed
- Permalink
- Report Inappropriate Content
2 Replies
Master III
2016-12-16
02:07 AM
- Mark as New
- Bookmark
- Subscribe
- Mute
- Subscribe to RSS Feed
- Permalink
- Report Inappropriate Content
Try:
Medida = Count(Classe)/Count(TOTAL Classe)
Not applicable
2016-12-16
06:59 AM
Author
- Mark as New
- Bookmark
- Subscribe
- Mute
- Subscribe to RSS Feed
- Permalink
- Report Inappropriate Content
Thanks
860 Views