Unlock a world of possibilities! Login now and discover the exclusive benefits awaiting you.
- Qlik Community
- :
- All Forums
- :
- QlikView App Dev
- :
- Day on Day comparison in a stacked bar chart
- Subscribe to RSS Feed
- Mark Topic as New
- Mark Topic as Read
- Float this Topic for Current User
- Bookmark
- Subscribe
- Mute
- Printer Friendly Page
- Mark as New
- Bookmark
- Subscribe
- Mute
- Subscribe to RSS Feed
- Permalink
- Report Inappropriate Content
Day on Day comparison in a stacked bar chart
Hi All,
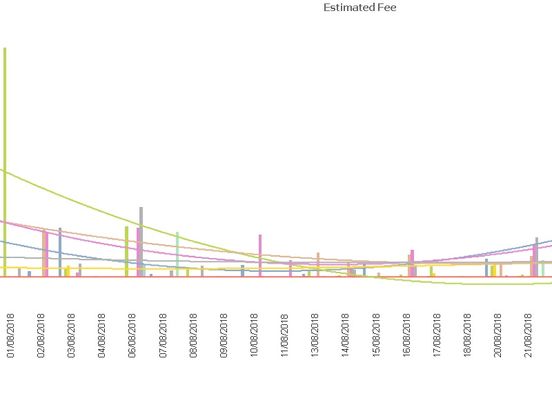
I have a chart based on the 2 dimensions
1. aggr(Grp,OPP_tDate)
2. Aggr(Only({<OPP_tDate=P(tDate)>}OPP_tDate),OPP_tDate)
Expression is:
sum({<OPP_tDate=P(tDate)>} intEstFees)
where Grp is a list of teams that I need to visualize their performance via a bar chart as below
Here's my LOAD script.
Fact_Table:
LOAD OPP_tDate,Grp,intEstFees
FROM myFactTableData.qvd (qvd);
MasterCalendar:
LOAD tWeek,tDay, tDate
FROM MasterCalendar.qvd (qvd);
The bar chart above looks OK, but I need to display additional series to create a day-on-day comparison or "time-on-time" comparison for the previous day / date, but I'm not sure what is the expression I should use or whether I need another dimension...
Can someone pls advise? Thanks...
